ERA5 Forecast Inference#
In this notebook, we will use the model trained using ERA5 data Jan 2018 to perform Forecasting on ERA5 from Jan 2019.
We will use a combination of what we have learned so far during this training xarray, and XGBoost.
Import libraries#
import numpy as np
import xarray as xr
import xgboost as xgb
from matplotlib import pyplot as plt
Define constants#
ZARR_URL = "gs://gcp-public-data-arco-era5/ar/full_37-1h-0p25deg-chunk-1.zarr-v3"
LAGS = list(range(1, 7))
START_DATE = "2018-12-26"  # 6 lags before Jan 1
FORECAST_START = "2019-01-01"
FORECAST_END = "2019-01-31"
MODEL_PATH = "../chapter4/era5_forecast/models/xgb_model_old.json"
Initialize the model#
booster = xgb.Booster()
booster.load_model(MODEL_PATH)
Function to create lagged features#
def create_lagged_features(da, lags):
    lagged = [da.shift(time=lag).rename(f"lag_{lag}") for lag in lags]
    return xr.merge(lagged + [da.rename("target")])
Prepare the data#
ds = xr.open_zarr(
        ZARR_URL,
        chunks={"time": 1},  # type: ignore
        storage_options={"token": "anon"},
    )

temp = ds["2m_temperature"].sel(
        time=slice(START_DATE, FORECAST_END),
    )
daily = temp.resample(time="1D").mean()
daily = daily.compute()
Perform inference#
predictions = []
dates = np.array(daily.sel(time=slice(FORECAST_START, FORECAST_END)).time)
for date in dates:
    i = np.where(daily.time == date)[0][0]
    if i < max(LAGS):
        continue  # skip if not enough lags

    lagged_stack = [daily.isel(time=i - lag) for lag in LAGS]
    X_pred = xr.concat(lagged_stack, dim="feature")
    X_pred = X_pred.stack(sample=("latitude", "longitude")).transpose(
        "sample", "feature"
    )
    dmatrix = xgb.DMatrix(X_pred.data)
    y_pred = booster.predict(dmatrix)
    n_lat = len(X_pred.latitude)
    n_lon = len(X_pred.longitude)

    # Reshape to spatial grid
    pred_grid = y_pred.reshape(len(daily.latitude), len(daily.longitude))
    da = xr.DataArray(
        pred_grid,
        coords={"latitude": daily.latitude, "longitude": daily.longitude},
        dims=["latitude", "longitude"],
        name="prediction",
    )
    da = da.expand_dims(time=[date])
    predictions.append(da)
Compute error metrics#
pred_stack = xr.concat(predictions, dim="time")
truth = daily.sel(time=slice(FORECAST_START, FORECAST_END))
error = pred_stack - truth
mae = xr.ufuncs.abs(error.mean(dim=["latitude", "longitude"]))
rmse = np.sqrt((error**2).mean(dim=["latitude", "longitude"]))
Plot the results#
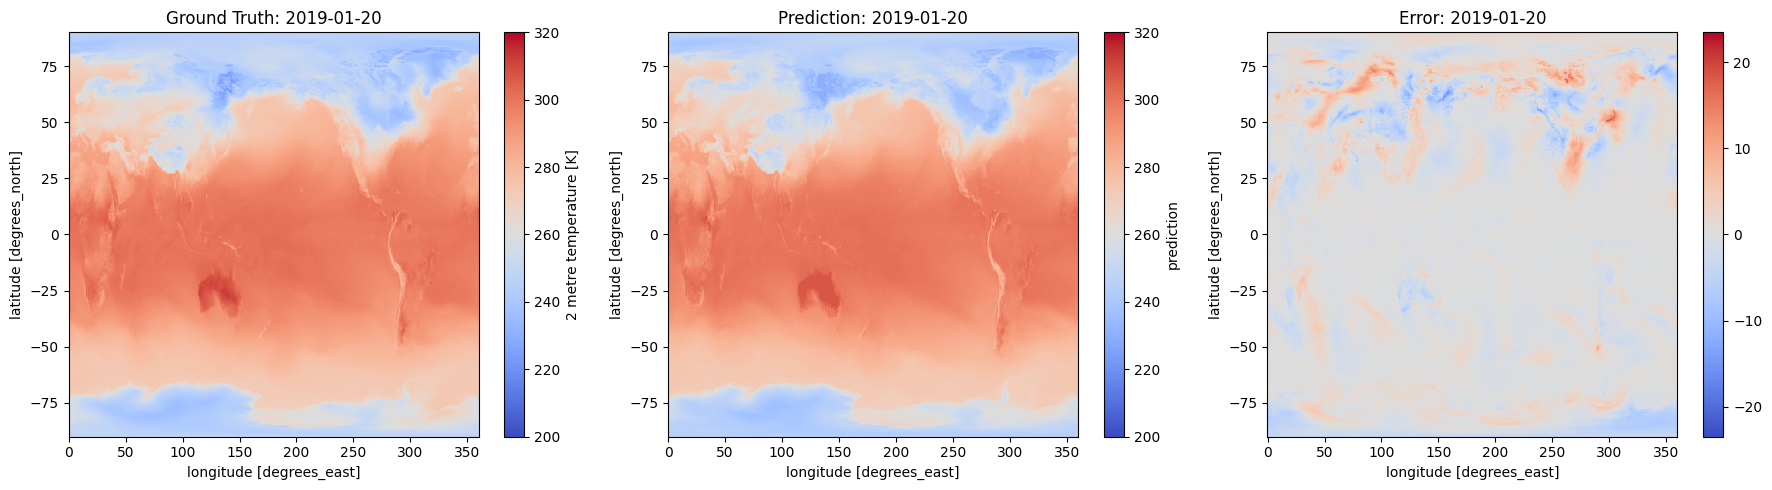
example_date = "2019-01-20"
truth_day = truth.sel(time=example_date)
pred_day = pred_stack.sel(time=example_date)
error_day = error.sel(time=example_date)
fig, axs = plt.subplots(1, 3, figsize=(18, 5))
truth_day.plot(ax=axs[0], cmap="coolwarm",vmin=200, vmax=320)
axs[0].set_title(f"Ground Truth: {example_date}")
pred_day.plot(ax=axs[1], cmap="coolwarm",vmin=200, vmax=320)
axs[1].set_title(f"Prediction: {example_date}")
error_day.plot(ax=axs[2], cmap="coolwarm")
axs[2].set_title(f"Error: {example_date}")
plt.tight_layout()
plt.show()
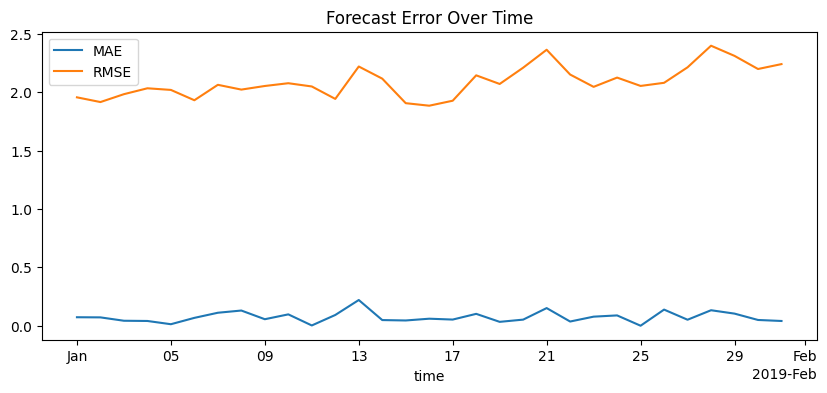
mae.plot(label="MAE", figsize=(10, 4))
rmse.plot(label="RMSE")
plt.legend()
plt.title("Forecast Error Over Time")
Text(0.5, 1.0, 'Forecast Error Over Time')