Dask With Xarray for Out-of-Memory Data#
Dask enables parallel and out-of-core computing with xarray
Load and process datasets that don’t fit in memory
Perform lazy computation and parallelize workloads using Dask + xarray
Use Dask with NetCDF, Zarr, and other large EO data formats
Problem |
Solution |
|---|---|
Dataset too big for memory |
Lazy loading with Dask |
Long computations |
Parallel execution |
Distributed/cluster processing |
Dask distributed scheduler |
Import Libraries#
import xarray as xr
from dask.distributed import Client
client = Client(memory_limit="2GB")
client
Client
Client-6189c7de-5018-11f0-9ea5-d6aeee621b7f
| Connection method: Cluster object | Cluster type: distributed.LocalCluster |
| Dashboard: http://127.0.0.1:8787/status |
Cluster Info
LocalCluster
f2dcba81
| Dashboard: http://127.0.0.1:8787/status | Workers: 4 |
| Total threads: 8 | Total memory: 7.45 GiB |
| Status: running | Using processes: True |
Scheduler Info
Scheduler
Scheduler-c46ee3f9-f7b8-4ecb-9bf6-75b0cb441008
| Comm: tcp://127.0.0.1:61571 | Workers: 4 |
| Dashboard: http://127.0.0.1:8787/status | Total threads: 8 |
| Started: Just now | Total memory: 7.45 GiB |
Workers
Worker: 0
| Comm: tcp://127.0.0.1:61583 | Total threads: 2 |
| Dashboard: http://127.0.0.1:61587/status | Memory: 1.86 GiB |
| Nanny: tcp://127.0.0.1:61574 | |
| Local directory: /var/folders/j3/513qxyhx4l30byl48tz1k1jr0000gn/T/dask-scratch-space/worker-zoe5hmsn | |
Worker: 1
| Comm: tcp://127.0.0.1:61585 | Total threads: 2 |
| Dashboard: http://127.0.0.1:61590/status | Memory: 1.86 GiB |
| Nanny: tcp://127.0.0.1:61576 | |
| Local directory: /var/folders/j3/513qxyhx4l30byl48tz1k1jr0000gn/T/dask-scratch-space/worker-x2xfw_il | |
Worker: 2
| Comm: tcp://127.0.0.1:61584 | Total threads: 2 |
| Dashboard: http://127.0.0.1:61589/status | Memory: 1.86 GiB |
| Nanny: tcp://127.0.0.1:61578 | |
| Local directory: /var/folders/j3/513qxyhx4l30byl48tz1k1jr0000gn/T/dask-scratch-space/worker-2hog1e48 | |
Worker: 3
| Comm: tcp://127.0.0.1:61586 | Total threads: 2 |
| Dashboard: http://127.0.0.1:61588/status | Memory: 1.86 GiB |
| Nanny: tcp://127.0.0.1:61580 | |
| Local directory: /var/folders/j3/513qxyhx4l30byl48tz1k1jr0000gn/T/dask-scratch-space/worker-zxvon9v_ | |
Xarray Dataset as NumPy Array#
ds = xr.tutorial.open_dataset("air_temperature")
print(ds)

da = ds["air"]
print("Data type:", type(da.data))
<xarray.Dataset> Size: 31MB
Dimensions:  (lat: 25, time: 2920, lon: 53)
Coordinates:
  * lat      (lat) float32 100B 75.0 72.5 70.0 67.5 65.0 ... 22.5 20.0 17.5 15.0
  * lon      (lon) float32 212B 200.0 202.5 205.0 207.5 ... 325.0 327.5 330.0
  * time     (time) datetime64[ns] 23kB 2013-01-01 ... 2014-12-31T18:00:00
Data variables:
    air      (time, lat, lon) float64 31MB ...
Attributes:
    Conventions:  COARDS
    title:        4x daily NMC reanalysis (1948)
    description:  Data is from NMC initialized reanalysis\n(4x/day).  These a...
    platform:     Model
    references:   http://www.esrl.noaa.gov/psd/data/gridded/data.ncep.reanaly...
Data type: <class 'numpy.ndarray'>
Xarray Dataset as Dask Array#
# Automatically chunks the dataset using Dask
ds = xr.tutorial.open_dataset("air_temperature", chunks={"time": 10})
print(ds)

# Dask-backed DataArray
da = ds["air"]
print("Data type:", type(da.data))
<xarray.Dataset> Size: 31MB
Dimensions:  (lat: 25, time: 2920, lon: 53)
Coordinates:
  * lat      (lat) float32 100B 75.0 72.5 70.0 67.5 65.0 ... 22.5 20.0 17.5 15.0
  * lon      (lon) float32 212B 200.0 202.5 205.0 207.5 ... 325.0 327.5 330.0
  * time     (time) datetime64[ns] 23kB 2013-01-01 ... 2014-12-31T18:00:00
Data variables:
    air      (time, lat, lon) float64 31MB dask.array<chunksize=(10, 25, 53), meta=np.ndarray>
Attributes:
    Conventions:  COARDS
    title:        4x daily NMC reanalysis (1948)
    description:  Data is from NMC initialized reanalysis\n(4x/day).  These a...
    platform:     Model
    references:   http://www.esrl.noaa.gov/psd/data/gridded/data.ncep.reanaly...
Data type: <class 'dask.array.core.Array'>
da
<xarray.DataArray 'air' (time: 2920, lat: 25, lon: 53)> Size: 31MB
dask.array<open_dataset-air, shape=(2920, 25, 53), dtype=float64, chunksize=(10, 25, 53), chunktype=numpy.ndarray>
Coordinates:
  * lat      (lat) float32 100B 75.0 72.5 70.0 67.5 65.0 ... 22.5 20.0 17.5 15.0
  * lon      (lon) float32 212B 200.0 202.5 205.0 207.5 ... 325.0 327.5 330.0
  * time     (time) datetime64[ns] 23kB 2013-01-01 ... 2014-12-31T18:00:00
Attributes:
    long_name:     4xDaily Air temperature at sigma level 995
    units:         degK
    precision:     2
    GRIB_id:       11
    GRIB_name:     TMP
    var_desc:      Air temperature
    dataset:       NMC Reanalysis
    level_desc:    Surface
    statistic:     Individual Obs
    parent_stat:   Other
actual_range: [185.16 322.1 ]Lazy Computation#
Nothing is computed until you call .compute()
mean_temp = da.mean(dim="time")  # Lazy
print("Still lazy:", type(mean_temp.data))

# Now trigger actual computation
mean_val = mean_temp.compute()
print("Mean computed:", mean_val.values)
Still lazy: <class 'dask.array.core.Array'>
Mean computed: [[260.37644178 260.18305137 259.88662671 ... 250.81590068 251.93811644
  253.43804795]
 [262.73439384 262.79397603 262.74933904 ... 249.75590411 251.58575685
  254.35926027]
 [264.7687637  264.32730822 264.06169521 ... 250.60789041 253.58351027
  257.71559932]
 ...
 [297.64986301 296.95333219 296.62931507 ... 296.81092466 296.28796233
  295.81645548]
 [298.12920205 297.93700685 297.47039384 ... 296.85954795 296.7770274
  296.44383562]
 [298.36615068 298.38573973 298.11414384 ... 297.33820548 297.28144521
  297.30510274]]
Understanding Chunks#
Dask splits data into chunks (blocks). Each operation works on each block independently.
print("Chunks:", da.chunks)
Chunks: ((10, 10, 10, 10, 10, 10, 10, 10, 10, 10, 10, 10, 10, 10, 10, 10, 10, 10, 10, 10, 10, 10, 10, 10, 10, 10, 10, 10, 10, 10, 10, 10, 10, 10, 10, 10, 10, 10, 10, 10, 10, 10, 10, 10, 10, 10, 10, 10, 10, 10, 10, 10, 10, 10, 10, 10, 10, 10, 10, 10, 10, 10, 10, 10, 10, 10, 10, 10, 10, 10, 10, 10, 10, 10, 10, 10, 10, 10, 10, 10, 10, 10, 10, 10, 10, 10, 10, 10, 10, 10, 10, 10, 10, 10, 10, 10, 10, 10, 10, 10, 10, 10, 10, 10, 10, 10, 10, 10, 10, 10, 10, 10, 10, 10, 10, 10, 10, 10, 10, 10, 10, 10, 10, 10, 10, 10, 10, 10, 10, 10, 10, 10, 10, 10, 10, 10, 10, 10, 10, 10, 10, 10, 10, 10, 10, 10, 10, 10, 10, 10, 10, 10, 10, 10, 10, 10, 10, 10, 10, 10, 10, 10, 10, 10, 10, 10, 10, 10, 10, 10, 10, 10, 10, 10, 10, 10, 10, 10, 10, 10, 10, 10, 10, 10, 10, 10, 10, 10, 10, 10, 10, 10, 10, 10, 10, 10, 10, 10, 10, 10, 10, 10, 10, 10, 10, 10, 10, 10, 10, 10, 10, 10, 10, 10, 10, 10, 10, 10, 10, 10, 10, 10, 10, 10, 10, 10, 10, 10, 10, 10, 10, 10, 10, 10, 10, 10, 10, 10, 10, 10, 10, 10, 10, 10, 10, 10, 10, 10, 10, 10, 10, 10, 10, 10, 10, 10, 10, 10, 10, 10, 10, 10, 10, 10, 10, 10, 10, 10, 10, 10, 10, 10, 10, 10, 10, 10, 10, 10, 10, 10, 10, 10, 10, 10, 10, 10, 10, 10, 10, 10, 10, 10), (25,), (53,))
ds = xr.tutorial.open_dataset("air_temperature").chunk({"time": 20})
da = ds["air"]
da
<xarray.DataArray 'air' (time: 2920, lat: 25, lon: 53)> Size: 31MB
dask.array<xarray-air, shape=(2920, 25, 53), dtype=float64, chunksize=(20, 25, 53), chunktype=numpy.ndarray>
Coordinates:
  * lat      (lat) float32 100B 75.0 72.5 70.0 67.5 65.0 ... 22.5 20.0 17.5 15.0
  * lon      (lon) float32 212B 200.0 202.5 205.0 207.5 ... 325.0 327.5 330.0
  * time     (time) datetime64[ns] 23kB 2013-01-01 ... 2014-12-31T18:00:00
Attributes:
    long_name:     4xDaily Air temperature at sigma level 995
    units:         degK
    precision:     2
    GRIB_id:       11
    GRIB_name:     TMP
    var_desc:      Air temperature
    dataset:       NMC Reanalysis
    level_desc:    Surface
    statistic:     Individual Obs
    parent_stat:   Other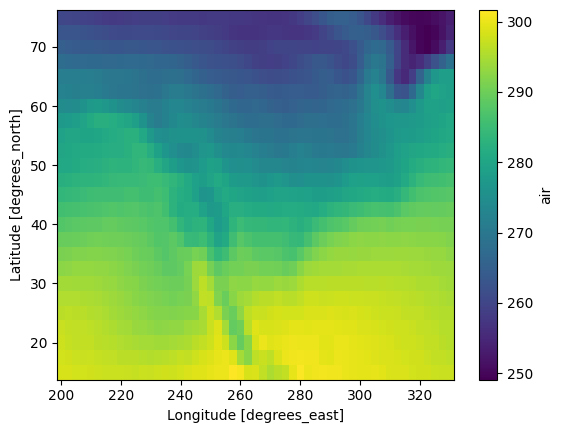
actual_range: [185.16 322.1 ]mean_temp = da.mean(dim="time")
mean_temp.plot()
<matplotlib.collections.QuadMesh at 0x1647d23c0>
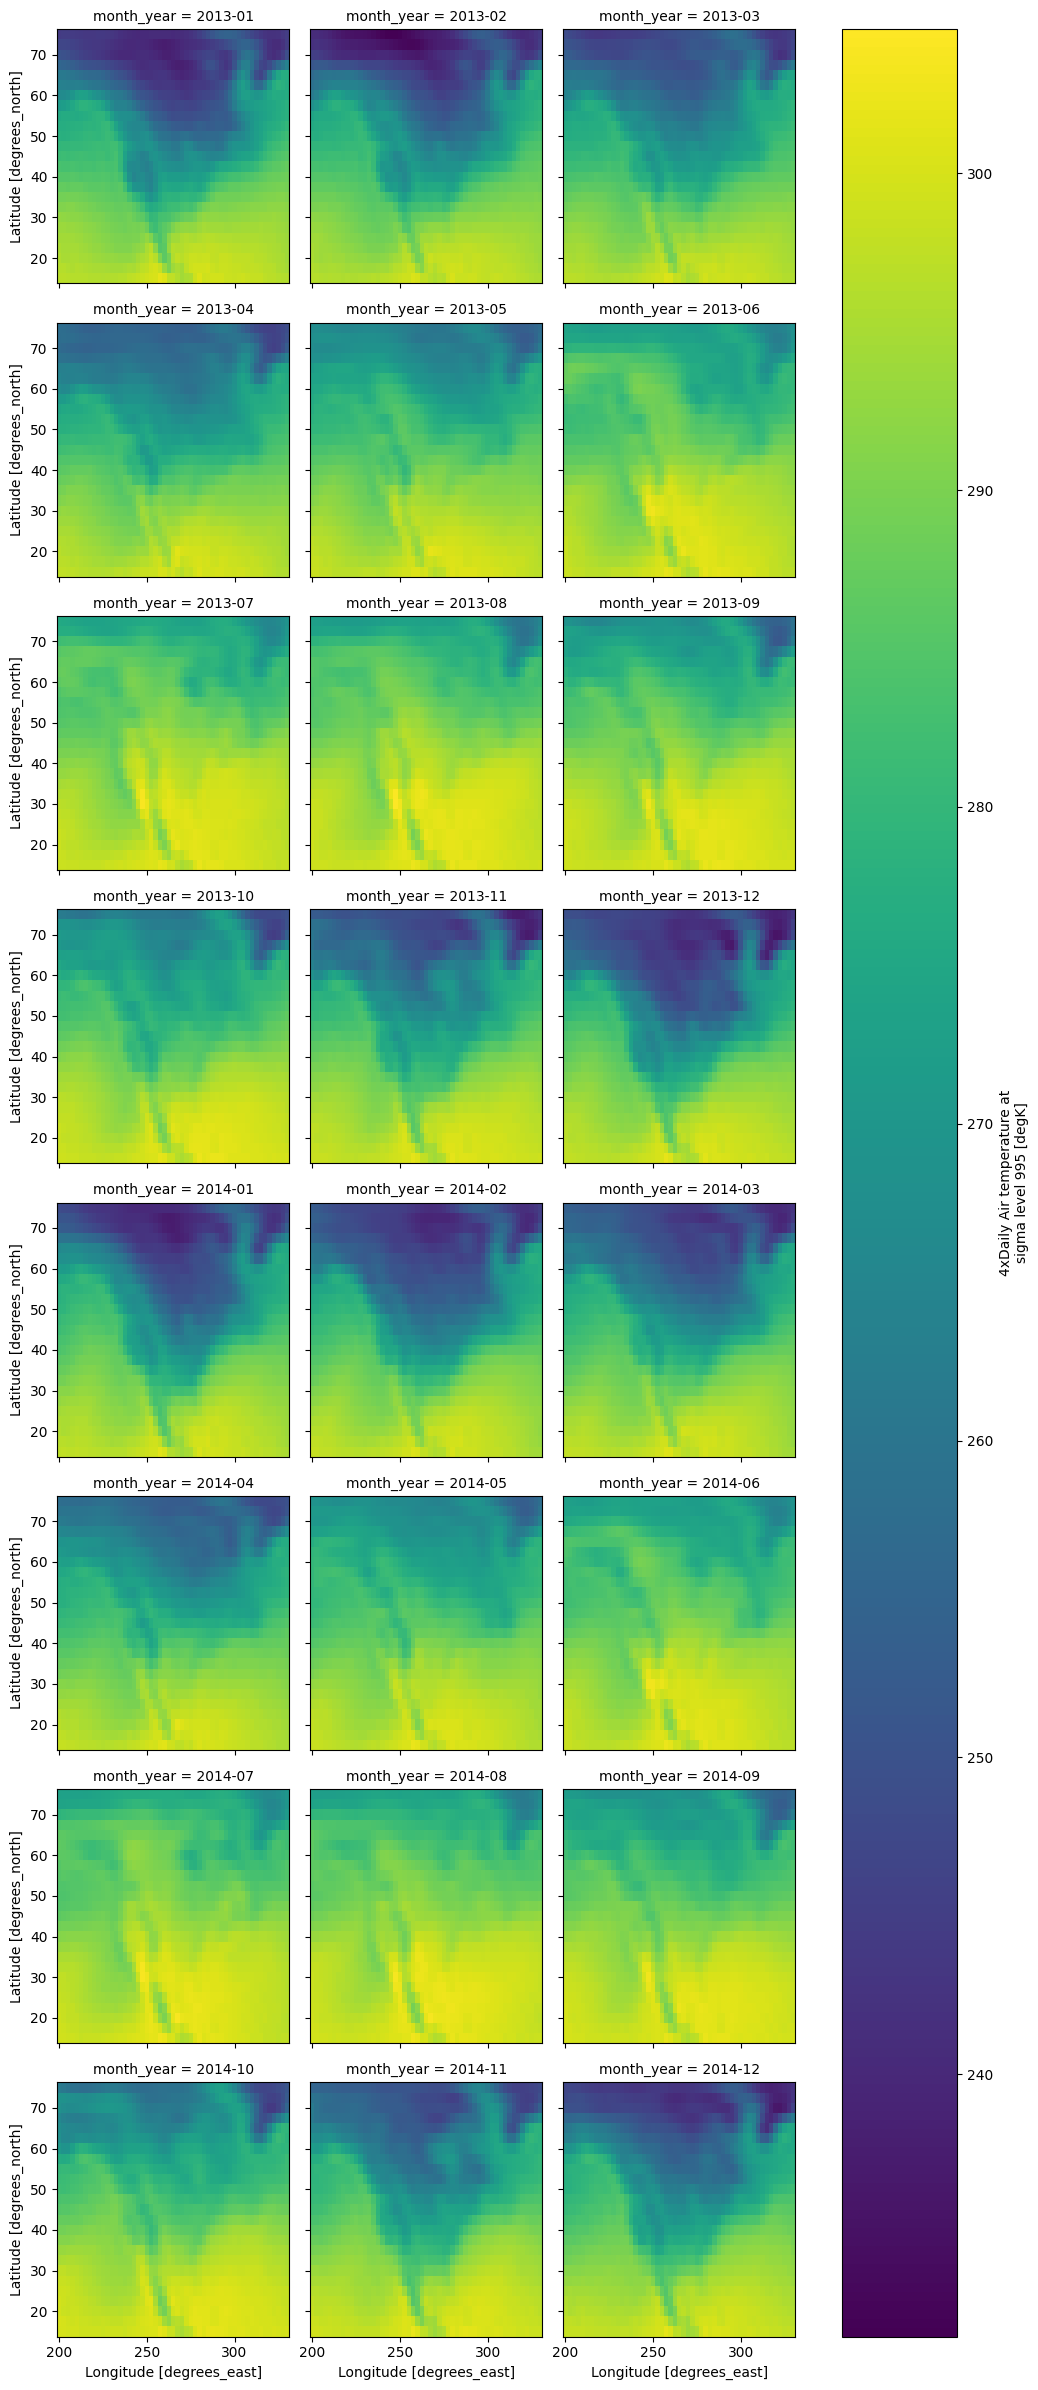
ds = xr.tutorial.open_dataset("air_temperature").chunk({"time": 50})
da = ds.air

da.coords["month_year"] = da["time"].to_index().to_period("M")

mean_by_month_year = da.groupby("month_year").mean(dim="time")
# Compute (parallel)
mean_by_month_year.compute().plot(col="month_year",col_wrap=3)
<xarray.plot.facetgrid.FacetGrid at 0x167547ed0>
ERA5 Data in Zarr Format#
ds = xr.open_zarr(
    "gs://gcp-public-data-arco-era5/ar/full_37-1h-0p25deg-chunk-1.zarr-v3",
    chunks={"time": 1},
    storage_options=dict(token="anon"),
)

temp = ds["2m_temperature"].sel(time=slice("2022-01-01", "2024-12-31"))

temp
<xarray.DataArray '2m_temperature' (time: 26304, latitude: 721, longitude: 1440)> Size: 109GB
dask.array<getitem, shape=(26304, 721, 1440), dtype=float32, chunksize=(1, 721, 1440), chunktype=numpy.ndarray>
Coordinates:
  * latitude   (latitude) float32 3kB 90.0 89.75 89.5 ... -89.5 -89.75 -90.0
  * longitude  (longitude) float32 6kB 0.0 0.25 0.5 0.75 ... 359.2 359.5 359.8
  * time       (time) datetime64[ns] 210kB 2022-01-01 ... 2024-12-31T23:00:00
Attributes:
    long_name:   2 metre temperature
    short_name:  t2m
units: KIf you are working on a remote machine on vscode, press Ctrl+Shit+P then type Ports: Focus on Ports View to see your the status of Dask cluster#
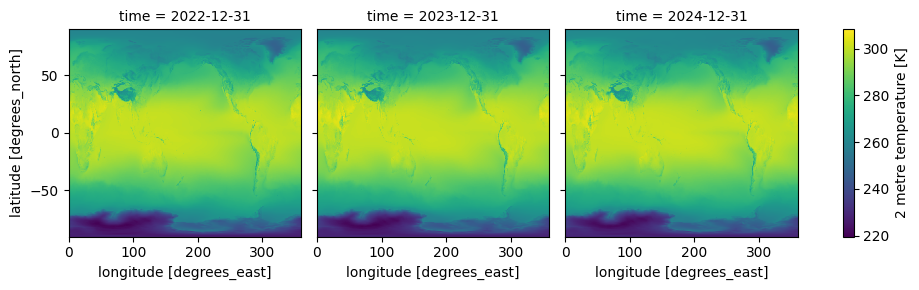
yearly_mean = temp.resample(time="1YE").mean()
result = yearly_mean.compute()
/Users/syam/virtualenvs/myvenv/lib/python3.13/site-packages/distributed/client.py:3371: UserWarning: Sending large graph of size 21.94 MiB.
This may cause some slowdown.
Consider loading the data with Dask directly
 or using futures or delayed objects to embed the data into the graph without repetition.
See also https://docs.dask.org/en/stable/best-practices.html#load-data-with-dask for more information.
  warnings.warn(
result.plot(col="time", col_wrap=3)
<xarray.plot.facetgrid.FacetGrid at 0x30311f890>
client.close()