Explore AWS STAC STAC With ODC and DASK#
Notebook Description#
This Jupyter Notebook demonstrates how to explore and process Sentinel-2 L2A satellite imagery data from the AWS STAC Catalogue using the Open Data Cube (ODC) and DASK. The notebook provides a step-by-step guide to querying, visualizing, and processing geospatial data efficiently with distributed computing.
Key Steps#
Library Imports:
Utilizes libraries such as
pystac_client,odc.stac,dask,geopandas,folium, andshapelyfor geospatial data processing and visualization.
STAC Catalogue Search:
Queries the AWS STAC Catalogue for Sentinel-2 L2A imagery based on spatial (bounding box), temporal (date range), and cloud cover filters.
Bounding Box Visualization:
Visualizes the queried bounding boxes and granules on an interactive map using
folium.
DASK Initialization:
Sets up DASK workers for distributed computing to handle large geospatial datasets efficiently.
Data Loading with ODC:
Loads the queried STAC items into an Open Data Cube (ODC) for further processing, specifying desired bands and resolution.
Distributed Computation:
Uses DASK to compute the loaded data, enabling efficient processing of large datasets.
Visualization:
Visualizes the processed results, including RGB composites, on an interactive map using
folium.
Use Case#
This notebook is ideal for users who want to:
Explore and process Sentinel-2 satellite imagery from the AWS STAC Catalogue.
Learn how to use ODC and DASK for handling large geospatial datasets.
Visualize geospatial data interactively on maps.
Import the required libraries#
import dask.distributed
import folium
import folium.plugins
import geopandas as gpd
import shapely.geometry
import yaml
from IPython.display import HTML, display
from pystac_client import Client
from odc.algo import to_rgba
from odc.stac import configure_rio, stac_load
import yaml
def convert_bounds(bbox, invert_y=False):
"""
Helper method for changing bounding box representation to leaflet notation
``(lon1, lat1, lon2, lat2) -> ((lat1, lon1), (lat2, lon2))``
"""
x1, y1, x2, y2 = bbox
if invert_y:
y1, y2 = y2, y1
return ((y1, x1), (y2, x2))
Search the STAC catalouge#
bbox =(19.0, 34.8, 28.3, 41.8)
start_date = "2022-07-07"
catalog = Client.open("https://earth-search.aws.element84.com/v1")
query = catalog.search(
collections=["sentinel-2-l2a"],
datetime=f"{start_date}",
limit=100,
bbox=bbox,
#query={"eo:cloud_cover": {"lt": 50}}
)
items = list(query.items())
print(f"Found: {len(items):d} datasets")
# Convert STAC items into a GeoJSON FeatureCollection
stac_json = query.item_collection_as_dict()
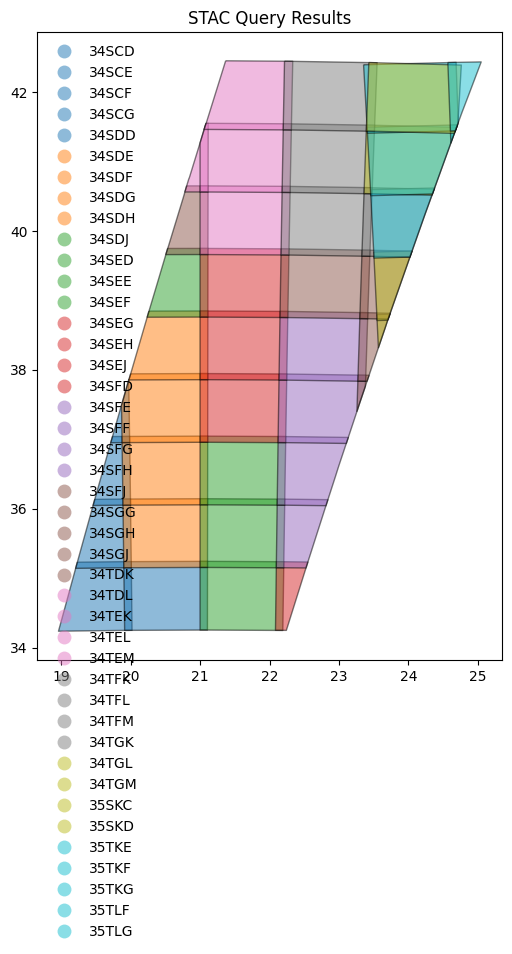
Found: 43 datasets
Visualize the bounding boxes in a figure#
gdf = gpd.GeoDataFrame.from_features(stac_json, "epsg:4326")
# Compute granule id from components
gdf["granule"] = (
gdf["mgrs:utm_zone"].apply(lambda x: f"{x:02d}")
+ gdf["mgrs:latitude_band"]
+ gdf["mgrs:grid_square"]
)
fig = gdf.plot(
"granule",
edgecolor="black",
categorical=True,
aspect="equal",
alpha=0.5,
figsize=(6, 12),
legend=True,
legend_kwds={"loc": "upper left", "frameon": False, "ncol": 1},
)
_ = fig.set_title("STAC Query Results")
cfg = """---
sentinel-s2-l2a-cogs:
assets:
'*':
data_type: uint16
nodata: 0
unit: '1'
SCL:
data_type: uint8
nodata: 0
unit: '1'
visual:
data_type: uint8
nodata: 0
unit: '1'
aliases: # Alias -> Canonical Name
red: B04
green: B03
blue: B02
"*":
warnings: ignore # Disable warnings about duplicate common names
"""
cfg = yaml.load(cfg, Loader=yaml.SafeLoader)
Visualize the bounding box using folium#
map1 = folium.Map()
folium.GeoJson(
shapely.geometry.box(*bbox),
style_function=lambda x: dict(fill=False, weight=1, opacity=0.7, color="olive"),
name="Query",
).add_to(map1)
gdf.explore(
"granule",
categorical=True,
tooltip=[
"granule",
"datetime",
"s2:nodata_pixel_percentage",
"eo:cloud_cover",
],
popup=True,
style_kwds=dict(fillOpacity=0.1, width=2),
name="STAC",
m=map1,
)
map1.fit_bounds(bounds=convert_bounds(gdf.unary_union.bounds))
map1
/var/folders/j3/513qxyhx4l30byl48tz1k1jr0000gn/T/ipykernel_46562/947103798.py:23: DeprecationWarning: The 'unary_union' attribute is deprecated, use the 'union_all()' method instead.
map1.fit_bounds(bounds=convert_bounds(gdf.unary_union.bounds))
Initiate DASK workers#
client = dask.distributed.Client()
configure_rio(cloud_defaults=True, aws={"aws_unsigned": True}, client=client)
display(client)
Client
Client-cc30cb9a-4dc1-11f0-b5e2-d6aeee621b7f
| Connection method: Cluster object | Cluster type: distributed.LocalCluster |
| Dashboard: http://127.0.0.1:8787/status |
Cluster Info
LocalCluster
eb64f09a
| Dashboard: http://127.0.0.1:8787/status | Workers: 4 |
| Total threads: 8 | Total memory: 16.00 GiB |
| Status: running | Using processes: True |
Scheduler Info
Scheduler
Scheduler-750f75ca-4582-4f81-b6ba-14e440bac4a1
| Comm: tcp://127.0.0.1:55480 | Workers: 4 |
| Dashboard: http://127.0.0.1:8787/status | Total threads: 8 |
| Started: Just now | Total memory: 16.00 GiB |
Workers
Worker: 0
| Comm: tcp://127.0.0.1:55495 | Total threads: 2 |
| Dashboard: http://127.0.0.1:55498/status | Memory: 4.00 GiB |
| Nanny: tcp://127.0.0.1:55483 | |
| Local directory: /var/folders/j3/513qxyhx4l30byl48tz1k1jr0000gn/T/dask-scratch-space/worker-p0hcn41j | |
Worker: 1
| Comm: tcp://127.0.0.1:55496 | Total threads: 2 |
| Dashboard: http://127.0.0.1:55501/status | Memory: 4.00 GiB |
| Nanny: tcp://127.0.0.1:55485 | |
| Local directory: /var/folders/j3/513qxyhx4l30byl48tz1k1jr0000gn/T/dask-scratch-space/worker-tw8fb3vq | |
Worker: 2
| Comm: tcp://127.0.0.1:55497 | Total threads: 2 |
| Dashboard: http://127.0.0.1:55500/status | Memory: 4.00 GiB |
| Nanny: tcp://127.0.0.1:55487 | |
| Local directory: /var/folders/j3/513qxyhx4l30byl48tz1k1jr0000gn/T/dask-scratch-space/worker-dk2nxmqi | |
Worker: 3
| Comm: tcp://127.0.0.1:55494 | Total threads: 2 |
| Dashboard: http://127.0.0.1:55499/status | Memory: 4.00 GiB |
| Nanny: tcp://127.0.0.1:55489 | |
| Local directory: /var/folders/j3/513qxyhx4l30byl48tz1k1jr0000gn/T/dask-scratch-space/worker-709p06fb | |
2025-06-21 03:47:16,248 - distributed.scheduler - WARNING - Worker failed to heartbeat for 307s; attempting restart: <WorkerState 'tcp://127.0.0.1:55494', name: 3, status: running, memory: 0, processing: 0>
2025-06-21 03:47:16,352 - distributed.scheduler - WARNING - Worker failed to heartbeat for 307s; attempting restart: <WorkerState 'tcp://127.0.0.1:55495', name: 0, status: running, memory: 0, processing: 0>
2025-06-21 03:47:16,357 - distributed.scheduler - WARNING - Worker failed to heartbeat for 307s; attempting restart: <WorkerState 'tcp://127.0.0.1:55496', name: 1, status: running, memory: 0, processing: 0>
2025-06-21 03:47:16,358 - distributed.scheduler - WARNING - Worker failed to heartbeat for 307s; attempting restart: <WorkerState 'tcp://127.0.0.1:55497', name: 2, status: running, memory: 0, processing: 0>
2025-06-21 03:47:17,177 - distributed.nanny - WARNING - Restarting worker
2025-06-21 03:47:17,179 - distributed.nanny - WARNING - Restarting worker
2025-06-21 03:47:17,182 - distributed.nanny - WARNING - Restarting worker
2025-06-21 03:47:17,211 - distributed.nanny - WARNING - Restarting worker
2025-06-22 01:27:19,051 - tornado.application - ERROR - Exception in callback <bound method SystemMonitor.update of <SystemMonitor: cpu: 2 memory: 38 MB fds: 189>>
Traceback (most recent call last):
File "/Users/syam/virtualenvs/myvenv/lib/python3.13/site-packages/tornado/ioloop.py", line 937, in _run
val = self.callback()
File "/Users/syam/virtualenvs/myvenv/lib/python3.13/site-packages/distributed/system_monitor.py", line 168, in update
net_ioc = psutil.net_io_counters()
File "/Users/syam/virtualenvs/myvenv/lib/python3.13/site-packages/psutil/__init__.py", line 2148, in net_io_counters
rawdict = _psplatform.net_io_counters()
OSError: [Errno 12] Cannot allocate memory
Load STAC items into ODC#
# Since we will plot it on a map we need to use `EPSG:3857` projection
crs = "epsg:3857"
zoom = 2**5 # overview level 5
xx = stac_load(
items,
bands=("red", "green", "blue"),
crs=crs,
resolution=10 * zoom,
chunks={}, # <-- use Dask
groupby="solar_day",
stac_cfg=cfg,
)
display(xx)
<xarray.Dataset> Size: 55MB
Dimensions: (y: 3654, x: 2509, time: 1)
Coordinates:
* y (y) float64 29kB 5.229e+06 5.229e+06 ... 4.06e+06 4.06e+06
* x (x) float64 20kB 2.084e+06 2.085e+06 ... 2.887e+06 2.887e+06
spatial_ref int32 4B 3857
* time (time) datetime64[ns] 8B 2022-07-07T09:28:48.671000
Data variables:
red (time, y, x) uint16 18MB dask.array<chunksize=(1, 3654, 2509), meta=np.ndarray>
green (time, y, x) uint16 18MB dask.array<chunksize=(1, 3654, 2509), meta=np.ndarray>
blue (time, y, x) uint16 18MB dask.array<chunksize=(1, 3654, 2509), meta=np.ndarray>Compute using DASK#
rgba = to_rgba(xx, clamp=(1, 3000))
_rgba = rgba.compute()
_rgba
<xarray.DataArray 'ro_rgba-dc8105eb-ea97b77bf1f0e341d339c981e5668684' (time: 1,
y: 3654,
x: 2509,
band: 4)> Size: 37MB
array([[[[0, 0, 0, 0],
[0, 0, 0, 0],
[0, 0, 0, 0],
...,
[0, 0, 0, 0],
[0, 0, 0, 0],
[0, 0, 0, 0]],
[[0, 0, 0, 0],
[0, 0, 0, 0],
[0, 0, 0, 0],
...,
[0, 0, 0, 0],
[0, 0, 0, 0],
[0, 0, 0, 0]],
[[0, 0, 0, 0],
[0, 0, 0, 0],
[0, 0, 0, 0],
...,
...
...,
[0, 0, 0, 0],
[0, 0, 0, 0],
[0, 0, 0, 0]],
[[0, 0, 0, 0],
[0, 0, 0, 0],
[0, 0, 0, 0],
...,
[0, 0, 0, 0],
[0, 0, 0, 0],
[0, 0, 0, 0]],
[[0, 0, 0, 0],
[0, 0, 0, 0],
[0, 0, 0, 0],
...,
[0, 0, 0, 0],
[0, 0, 0, 0],
[0, 0, 0, 0]]]], shape=(1, 3654, 2509, 4), dtype=uint8)
Coordinates:
* y (y) float64 29kB 5.229e+06 5.229e+06 ... 4.06e+06 4.06e+06
* x (x) float64 20kB 2.084e+06 2.085e+06 ... 2.887e+06 2.887e+06
spatial_ref int32 4B 3857
* time (time) datetime64[ns] 8B 2022-07-07T09:28:48.671000
* band (band) <U1 16B 'r' 'g' 'b' 'a'
Attributes:
crs: PROJCRS["WGS 84 / Pseudo-Mercator",BASEGEOGCRS["WGS 84",ENSEMBL...Visualize results using folium#
map2 = folium.Map()
folium.GeoJson(
shapely.geometry.box(*bbox),
style_function=lambda x: dict(fill=False, weight=1, opacity=0.7, color="olive"),
name="Query",
).add_to(map2)
gdf.explore(
"granule",
categorical=True,
tooltip=[
"granule",
"datetime",
"s2:nodata_pixel_percentage",
"eo:cloud_cover",
],
popup=True,
style_kwds=dict(fillOpacity=0.1, width=2),
name="STAC",
m=map2,
)
# Image bounds are specified in Lat/Lon order with Lat axis inversed
image_bounds = convert_bounds(_rgba.geobox.geographic_extent.boundingbox, invert_y=True)
img_ovr = folium.raster_layers.ImageOverlay(
_rgba.isel(time=0).data, bounds=image_bounds, name="Image"
)
img_ovr.add_to(map2)
map2.fit_bounds(bounds=image_bounds)
folium.LayerControl().add_to(map2)
folium.plugins.Fullscreen().add_to(map2)
map2
/var/folders/j3/513qxyhx4l30byl48tz1k1jr0000gn/T/ipykernel_46562/870828199.py:26: DeprecationWarning: Geobox extraction logic has moved to odc-geo and the .geobox property is now deprecated.Please access via .odc.geobox instead.
image_bounds = convert_bounds(_rgba.geobox.geographic_extent.boundingbox, invert_y=True)