Introduction to Xarray#

What is Xarray?#
Multidimensional labled data arrays (like NumPy but with coordinates and metadata).
Designed for Earth science and climate data.
Handles NetCDF, GRIB, Zarr, and other formats.
Supports lazy evaluation and Dask for large datasets.
Core Concepts#
DataArray:
One variable with coordinates and metadata.
Similar to numpy ndarray but with labels.
Dataset:
A collection of DataArrays.
Similar to a dictionary of DataArrays.
Can have shared coordinates and attributes.
Coordinates:
Labels for dimensions (e.g., time, latitude, longitude).
Attributes:
Metadata for DataArrays and Datasets (e.g., units, descriptions).
Indexing:
Accessing data using labels instead of integer indices.
Import libraries#
import xarray as xr
import pandas as pd
import numpy as np
Create a DataArray#
data = np.random.rand(3,4)
coords = {"time":pd.date_range("2024-01-01",periods = 3),"x":["a","b","c","d"]}
da = xr.DataArray(data, coords=coords, dims=["time", "x"],name="temperature")
da.attrs["created"] = pd.Timestamp.now()
da.attrs["description"] = "random temperature data"
print ("full data array:",da)
print ("coordinates:",da.coords)
print ("dimensions:",da.dims)
print ("shape:",da.shape)
print ("attr:",da.attrs)
print ("data",da.data)
full data array: <xarray.DataArray 'temperature' (time: 3, x: 4)> Size: 96B
array([[0.81622085, 0.84735095, 0.78511268, 0.42797343],
       [0.02546469, 0.75821049, 0.17291016, 0.96740412],
       [0.87075239, 0.52794664, 0.63172434, 0.07998903]])
Coordinates:
  * time     (time) datetime64[ns] 24B 2024-01-01 2024-01-02 2024-01-03
  * x        (x) <U1 16B 'a' 'b' 'c' 'd'
Attributes:
    created:      2025-06-23 10:49:44.606908
    description:  random temperature data
coordinates: Coordinates:
  * time     (time) datetime64[ns] 24B 2024-01-01 2024-01-02 2024-01-03
  * x        (x) <U1 16B 'a' 'b' 'c' 'd'
dimensions: ('time', 'x')
shape: (3, 4)
attr: {'created': Timestamp('2025-06-23 10:49:44.606908'), 'description': 'random temperature data'}
data [[0.81622085 0.84735095 0.78511268 0.42797343]
 [0.02546469 0.75821049 0.17291016 0.96740412]
 [0.87075239 0.52794664 0.63172434 0.07998903]]
Create a Dataset#
ds = xr.Dataset({"temperature":da,"pressure":(("time","x"),np.random.rand(3,4))})
print ("full dataset:",ds)
print ("variables:",ds.variables)
print ("dimensions:",ds.dims)
print("coordinates:",ds.coords)
print ("attr:",ds.attrs)
full dataset: <xarray.Dataset> Size: 232B
Dimensions:      (time: 3, x: 4)
Coordinates:
  * time         (time) datetime64[ns] 24B 2024-01-01 2024-01-02 2024-01-03
  * x            (x) <U1 16B 'a' 'b' 'c' 'd'
Data variables:
    temperature  (time, x) float64 96B 0.8162 0.8474 0.7851 ... 0.6317 0.07999
    pressure     (time, x) float64 96B 0.4356 0.4608 0.6451 ... 0.9273 0.6405
variables: Frozen({'time': <xarray.IndexVariable 'time' (time: 3)> Size: 24B
array(['2024-01-01T00:00:00.000000000', '2024-01-02T00:00:00.000000000',
       '2024-01-03T00:00:00.000000000'], dtype='datetime64[ns]'), 'x': <xarray.IndexVariable 'x' (x: 4)> Size: 16B
array(['a', 'b', 'c', 'd'], dtype='<U1'), 'temperature': <xarray.Variable (time: 3, x: 4)> Size: 96B
array([[0.81622085, 0.84735095, 0.78511268, 0.42797343],
       [0.02546469, 0.75821049, 0.17291016, 0.96740412],
       [0.87075239, 0.52794664, 0.63172434, 0.07998903]])
Attributes:
    created:      2025-06-23 10:49:44.606908
    description:  random temperature data, 'pressure': <xarray.Variable (time: 3, x: 4)> Size: 96B
array([[0.43558267, 0.46083827, 0.64505775, 0.85668732],
       [0.44970239, 0.68484891, 0.02462753, 0.14572613],
       [0.4872204 , 0.4218475 , 0.92731831, 0.64052972]])})
dimensions: FrozenMappingWarningOnValuesAccess({'time': 3, 'x': 4})
coordinates: Coordinates:
  * time     (time) datetime64[ns] 24B 2024-01-01 2024-01-02 2024-01-03
  * x        (x) <U1 16B 'a' 'b' 'c' 'd'
attr: {}
Indexing, Selecting and Slicing#
temps = xr.DataArray(
    data=[[15, 20, 25], [10, 12, 14]],
    dims=["location", "time"],
    coords={"location": ["CityA", "CityB"], "time": ["Morning", "Noon","Evening"]},
    name="temperature_C",
)
print(temps)

# Create a Dataset with multiple variables
ds = xr.Dataset(
    {
        "temperature_C": temps,
        "humidity": (("location", "time"), [[80, 75, 70], [65, 60, 55]]),
    }
)
print(ds)
<xarray.DataArray 'temperature_C' (location: 2, time: 3)> Size: 48B
array([[15, 20, 25],
       [10, 12, 14]])
Coordinates:
  * location  (location) <U5 40B 'CityA' 'CityB'
  * time      (time) <U7 84B 'Morning' 'Noon' 'Evening'
<xarray.Dataset> Size: 220B
Dimensions:        (location: 2, time: 3)
Coordinates:
  * location       (location) <U5 40B 'CityA' 'CityB'
  * time           (time) <U7 84B 'Morning' 'Noon' 'Evening'
Data variables:
    temperature_C  (location, time) int64 48B 15 20 25 10 12 14
    humidity       (location, time) int64 48B 80 75 70 65 60 55
ds
<xarray.Dataset> Size: 220B
Dimensions:        (location: 2, time: 3)
Coordinates:
  * location       (location) <U5 40B 'CityA' 'CityB'
  * time           (time) <U7 84B 'Morning' 'Noon' 'Evening'
Data variables:
    temperature_C  (location, time) int64 48B 15 20 25 10 12 14
humidity (location, time) int64 48B 80 75 70 65 60 55# Select by coordinate label
print("Select CityA data:")
print(ds.sel(location="CityA"))
# Select by integer position
print("Select first location data:")
print(ds.isel(location=0))
# Select multiple locations
print("Select CityA and CityB data:")
print(ds.sel(location=["CityA", "CityB"]))
# Boolean indexing example
print("Select temperature > 12:")
print(ds["temperature_C"].where(ds["temperature_C"] > 12, drop=True))
Select CityA data:
<xarray.Dataset> Size: 152B
Dimensions:        (time: 3)
Coordinates:
    location       <U5 20B 'CityA'
  * time           (time) <U7 84B 'Morning' 'Noon' 'Evening'
Data variables:
    temperature_C  (time) int64 24B 15 20 25
    humidity       (time) int64 24B 80 75 70
Select first location data:
<xarray.Dataset> Size: 152B
Dimensions:        (time: 3)
Coordinates:
    location       <U5 20B 'CityA'
  * time           (time) <U7 84B 'Morning' 'Noon' 'Evening'
Data variables:
    temperature_C  (time) int64 24B 15 20 25
    humidity       (time) int64 24B 80 75 70
Select CityA and CityB data:
<xarray.Dataset> Size: 220B
Dimensions:        (location: 2, time: 3)
Coordinates:
  * location       (location) <U5 40B 'CityA' 'CityB'
  * time           (time) <U7 84B 'Morning' 'Noon' 'Evening'
Data variables:
    temperature_C  (location, time) int64 48B 15 20 25 10 12 14
    humidity       (location, time) int64 48B 80 75 70 65 60 55
Select temperature > 12:
<xarray.DataArray 'temperature_C' (location: 2, time: 3)> Size: 48B
array([[15., 20., 25.],
       [nan, nan, 14.]])
Coordinates:
  * location  (location) <U5 40B 'CityA' 'CityB'
  * time      (time) <U7 84B 'Morning' 'Noon' 'Evening'
Real Data Example#
ds = xr.tutorial.open_dataset('era5-2mt-2019-03-uk.grib')
ds
/Users/syam/virtualenvs/myvenv/lib/python3.13/site-packages/cfgrib/xarray_plugin.py:131: FutureWarning: In a future version of xarray decode_timedelta will default to False rather than None. To silence this warning, set decode_timedelta to True, False, or a 'CFTimedeltaCoder' instance.
  vars, attrs, coord_names = xr.conventions.decode_cf_variables(
<xarray.Dataset> Size: 5MB
Dimensions:     (time: 744, latitude: 33, longitude: 49)
Coordinates:
    number      int64 8B ...
  * time        (time) datetime64[ns] 6kB 2019-03-01 ... 2019-03-31T23:00:00
    step        timedelta64[ns] 8B ...
    surface     float64 8B ...
  * latitude    (latitude) float64 264B 58.0 57.75 57.5 ... 50.5 50.25 50.0
  * longitude   (longitude) float64 392B -10.0 -9.75 -9.5 -9.25 ... 1.5 1.75 2.0
    valid_time  (time) datetime64[ns] 6kB ...
Data variables:
    t2m         (time, latitude, longitude) float32 5MB ...
Attributes:
    GRIB_edition:            1
    GRIB_centre:             ecmf
    GRIB_centreDescription:  European Centre for Medium-Range Weather Forecasts
    GRIB_subCentre:          0
    Conventions:             CF-1.7
    institution:             European Centre for Medium-Range Weather Forecasts
history: 2025-06-23T11:08 GRIB to CDM+CF via cfgrib-0.9.1...Inspect the Dataset#
print ("DIMENTIONS",ds.dims)
print ("COORDINATES",ds.coords)
print ("DATA VARIABLES",ds.data_vars)
print ("ATTRIBUTES",ds.attrs)
DIMENTIONS FrozenMappingWarningOnValuesAccess({'time': 744, 'latitude': 33, 'longitude': 49})
COORDINATES Coordinates:
number int64 8B ...
* time (time) datetime64[ns] 6kB 2019-03-01 ... 2019-03-31T23:00:00
step timedelta64[ns] 8B ...
surface float64 8B ...
* latitude (latitude) float64 264B 58.0 57.75 57.5 ... 50.5 50.25 50.0
* longitude (longitude) float64 392B -10.0 -9.75 -9.5 -9.25 ... 1.5 1.75 2.0
valid_time (time) datetime64[ns] 6kB ...
DATA VARIABLES Data variables:
t2m (time, latitude, longitude) float32 5MB ...
ATTRIBUTES {'GRIB_edition': 1, 'GRIB_centre': 'ecmf', 'GRIB_centreDescription': 'European Centre for Medium-Range Weather Forecasts', 'GRIB_subCentre': 0, 'Conventions': 'CF-1.7', 'institution': 'European Centre for Medium-Range Weather Forecasts', 'history': '2025-06-23T11:08 GRIB to CDM+CF via cfgrib-0.9.15.0/ecCodes-2.41.0 with {"source": "../../../../../../Library/Caches/xarray_tutorial_data/fbb9a0d5090f059b49c88c719140d7ae-era5-2mt-2019-03-uk.grib", "filter_by_keys": {}, "encode_cf": ["parameter", "time", "geography", "vertical"]}'}
ds["t2m"]
<xarray.DataArray 't2m' (time: 744, latitude: 33, longitude: 49)> Size: 5MB
[1203048 values with dtype=float32]
Coordinates:
number int64 8B ...
* time (time) datetime64[ns] 6kB 2019-03-01 ... 2019-03-31T23:00:00
step timedelta64[ns] 8B ...
surface float64 8B ...
* latitude (latitude) float64 264B 58.0 57.75 57.5 ... 50.5 50.25 50.0
* longitude (longitude) float64 392B -10.0 -9.75 -9.5 -9.25 ... 1.5 1.75 2.0
valid_time (time) datetime64[ns] 6kB ...
Attributes: (12/31)
GRIB_paramId: 167
GRIB_dataType: an
GRIB_numberOfPoints: 1617
GRIB_typeOfLevel: surface
GRIB_stepUnits: 1
GRIB_stepType: instant
... ...
GRIB_shortName: 2t
GRIB_totalNumber: 0
GRIB_units: K
long_name: 2 metre temperature
units: K
standard_name: unknownInspect the DataArray#
da = ds.t2m
print(da.name)
print (da.dims)
print (da.coords)
t2m
('time', 'latitude', 'longitude')
Coordinates:
number int64 8B ...
* time (time) datetime64[ns] 6kB 2019-03-01 ... 2019-03-31T23:00:00
step timedelta64[ns] 8B ...
surface float64 8B ...
* latitude (latitude) float64 264B 58.0 57.75 57.5 ... 50.5 50.25 50.0
* longitude (longitude) float64 392B -10.0 -9.75 -9.5 -9.25 ... 1.5 1.75 2.0
valid_time (time) datetime64[ns] 6kB ...
da.longitude
<xarray.DataArray 'longitude' (longitude: 49)> Size: 392B
array([-10. , -9.75, -9.5 , -9.25, -9. , -8.75, -8.5 , -8.25, -8. ,
-7.75, -7.5 , -7.25, -7. , -6.75, -6.5 , -6.25, -6. , -5.75,
-5.5 , -5.25, -5. , -4.75, -4.5 , -4.25, -4. , -3.75, -3.5 ,
-3.25, -3. , -2.75, -2.5 , -2.25, -2. , -1.75, -1.5 , -1.25,
-1. , -0.75, -0.5 , -0.25, 0. , 0.25, 0.5 , 0.75, 1. ,
1.25, 1.5 , 1.75, 2. ])
Coordinates:
number int64 8B ...
step timedelta64[ns] 8B ...
surface float64 8B ...
* longitude (longitude) float64 392B -10.0 -9.75 -9.5 -9.25 ... 1.5 1.75 2.0
Attributes:
units: degrees_east
standard_name: longitude
long_name: longitudeda.coords["latitude"]
<xarray.DataArray 'latitude' (latitude: 33)> Size: 264B
array([58.  , 57.75, 57.5 , 57.25, 57.  , 56.75, 56.5 , 56.25, 56.  , 55.75,
       55.5 , 55.25, 55.  , 54.75, 54.5 , 54.25, 54.  , 53.75, 53.5 , 53.25,
       53.  , 52.75, 52.5 , 52.25, 52.  , 51.75, 51.5 , 51.25, 51.  , 50.75,
       50.5 , 50.25, 50.  ])
Coordinates:
number int64 8B ...
step timedelta64[ns] 8B ...
surface float64 8B ...
* latitude (latitude) float64 264B 58.0 57.75 57.5 57.25 ... 50.5 50.25 50.0
Attributes:
units: degrees_north
standard_name: latitude
long_name: latitude
stored_direction: decreasingda.attrs
{'GRIB_paramId': 167,
 'GRIB_dataType': 'an',
 'GRIB_numberOfPoints': 1617,
 'GRIB_typeOfLevel': 'surface',
 'GRIB_stepUnits': 1,
 'GRIB_stepType': 'instant',
 'GRIB_gridType': 'regular_ll',
 'GRIB_uvRelativeToGrid': 0,
 'GRIB_NV': 0,
 'GRIB_Nx': 49,
 'GRIB_Ny': 33,
 'GRIB_cfName': 'unknown',
 'GRIB_cfVarName': 't2m',
 'GRIB_gridDefinitionDescription': 'Latitude/Longitude Grid',
 'GRIB_iDirectionIncrementInDegrees': 0.25,
 'GRIB_iScansNegatively': 0,
 'GRIB_jDirectionIncrementInDegrees': 0.25,
 'GRIB_jPointsAreConsecutive': 0,
 'GRIB_jScansPositively': 0,
 'GRIB_latitudeOfFirstGridPointInDegrees': 58.0,
 'GRIB_latitudeOfLastGridPointInDegrees': 50.0,
 'GRIB_longitudeOfFirstGridPointInDegrees': -10.0,
 'GRIB_longitudeOfLastGridPointInDegrees': 2.0,
 'GRIB_missingValue': 3.4028234663852886e+38,
 'GRIB_name': '2 metre temperature',
 'GRIB_shortName': '2t',
 'GRIB_totalNumber': 0,
 'GRIB_units': 'K',
 'long_name': '2 metre temperature',
 'units': 'K',
 'standard_name': 'unknown'}
da.attrs["meditwin"] = "mediterranean twin summer school"
da.attrs
{'GRIB_paramId': 167,
 'GRIB_dataType': 'an',
 'GRIB_numberOfPoints': 1617,
 'GRIB_typeOfLevel': 'surface',
 'GRIB_stepUnits': 1,
 'GRIB_stepType': 'instant',
 'GRIB_gridType': 'regular_ll',
 'GRIB_uvRelativeToGrid': 0,
 'GRIB_NV': 0,
 'GRIB_Nx': 49,
 'GRIB_Ny': 33,
 'GRIB_cfName': 'unknown',
 'GRIB_cfVarName': 't2m',
 'GRIB_gridDefinitionDescription': 'Latitude/Longitude Grid',
 'GRIB_iDirectionIncrementInDegrees': 0.25,
 'GRIB_iScansNegatively': 0,
 'GRIB_jDirectionIncrementInDegrees': 0.25,
 'GRIB_jPointsAreConsecutive': 0,
 'GRIB_jScansPositively': 0,
 'GRIB_latitudeOfFirstGridPointInDegrees': 58.0,
 'GRIB_latitudeOfLastGridPointInDegrees': 50.0,
 'GRIB_longitudeOfFirstGridPointInDegrees': -10.0,
 'GRIB_longitudeOfLastGridPointInDegrees': 2.0,
 'GRIB_missingValue': 3.4028234663852886e+38,
 'GRIB_name': '2 metre temperature',
 'GRIB_shortName': '2t',
 'GRIB_totalNumber': 0,
 'GRIB_units': 'K',
 'long_name': '2 metre temperature',
 'units': 'K',
 'standard_name': 'unknown',
 'meditwin': 'mediterranean twin summer school'}
Accessing Data in a DataArray as a NumPy Array#
print(da.data)
print(da.data.shape)
print(type(da.data))
[[[282.4248  282.30762 282.18848 ... 279.29004 279.3545  279.40918]
  [282.55957 282.4502  282.33887 ... 279.22168 279.2412  279.26074]
  [282.68262 282.6162  282.55957 ... 279.12598 279.15723 279.18457]
  ...
  [283.8623  283.76855 283.66895 ... 282.4287  282.22754 281.8545 ]
  [283.87012 283.7627  283.65723 ... 282.4209  282.2373  281.9287 ]
  [283.87598 283.73535 283.62988 ... 281.98535 281.95996 282.08887]]

 [[282.5188  282.3977  282.27075 ... 279.3606  279.40356 279.43872]
  [282.66528 282.57153 282.47583 ... 279.2981  279.31372 279.3274 ]
  [282.75317 282.6809  282.6145  ... 279.15942 279.18286 279.20435]
  ...
  [283.91724 283.79614 283.67505 ... 282.34888 282.11646 281.78442]
  [283.9309  283.79614 283.6692  ... 282.38208 282.17505 281.88013]
  [283.94653 283.79614 283.66724 ... 281.82935 281.8235  281.9524 ]]

 [[282.6958  282.5708  282.42627 ... 279.44775 279.4751  279.49854]
  [282.7036  282.6372  282.5708  ... 279.42822 279.4419  279.45557]
  [282.70752 282.65283 282.60205 ... 279.23096 279.30518 279.36768]
  ...
  [284.00244 283.85986 283.7173  ... 282.2329  282.0415  281.82275]
  [283.99854 283.854   283.7212  ... 282.31494 282.14697 281.89307]
  [283.99854 283.86182 283.729   ... 281.68408 281.6333  281.75244]]

 ...

 [[281.23022 281.3181  281.4099  ... 278.17358 278.14624 278.11108]
  [281.2517  281.32593 281.3982  ... 278.13257 278.07593 278.01733]
  [281.29468 281.32593 281.3474  ... 278.09546 278.03296 277.97046]
  ...
  [283.4685  283.3806  283.32202 ... 282.32202 282.02905 281.86694]
  [283.4978  283.40405 283.32007 ... 283.15015 282.8728  282.59155]
  [283.47046 283.41577 283.32983 ... 283.07983 282.99585 282.98218]]

 [[281.15845 281.17212 281.18774 ... 278.0276  277.99634 277.95142]
  [281.17212 281.17798 281.1819  ... 278.03345 277.9436  277.8518 ]
  [281.1526  281.15845 281.1643  ... 278.02954 277.9729  277.9104 ]
  ...
  [283.51782 283.36743 283.3186  ... 281.8772  281.54517 281.3772 ]
  [283.47876 283.36743 283.3225  ... 282.469   282.16626 281.92017]
  [283.4104  283.42212 283.37915 ... 282.1565  282.1194  282.12134]]

 [[281.09937 281.14038 281.1853  ... 278.13257 278.05835 277.9685 ]
  [281.1189  281.15405 281.18726 ... 278.16382 278.0271  277.88843]
  [281.1599  281.17554 281.1853  ... 278.11108 278.04272 277.9607 ]
  ...
  [283.65015 283.4646  283.406   ... 281.64624 281.15796 280.86108]
  [283.60132 283.4607  283.406   ... 282.1267  281.66772 281.28882]
  [283.47437 283.52124 283.4685  ... 281.66968 281.54468 281.45483]]]
(744, 33, 49)
<class 'numpy.ndarray'>
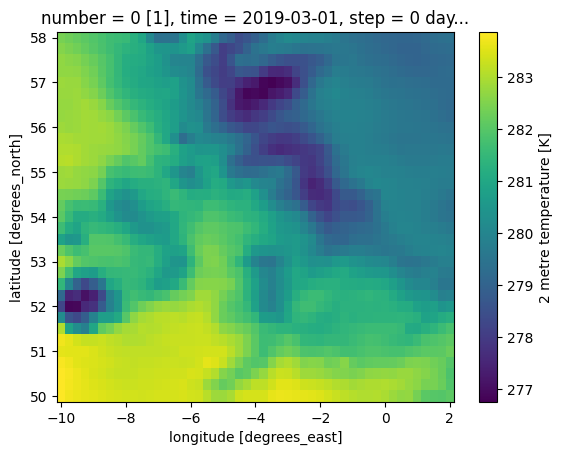
Analysis Using Xarray#
ds.t2m.isel(time=0).plot(x="longitude")
<matplotlib.collections.QuadMesh at 0x15168f770>
import xarray as xr
import ipywidgets as widgets
import matplotlib.pyplot as plt
from IPython.display import display

time_slider = widgets.IntSlider(
    value=0,
    min=0,
    max=len(ds.time) - 1,
    step=1,
    description="Time Index:",
    continuous_update=False,
)


# Plot function that updates with slider
def plot_time_index(time_idx):
    plt.figure(figsize=(10, 5))
    ds.t2m.isel(time=time_idx).plot(x="longitude")
    plt.title(f"t2m at time index {time_idx} ({str(ds.time[time_idx].values)})")
    plt.show()


# Link widget to plot function
widgets.interact(plot_time_index, time_idx=time_slider)
<function __main__.plot_time_index(time_idx)>
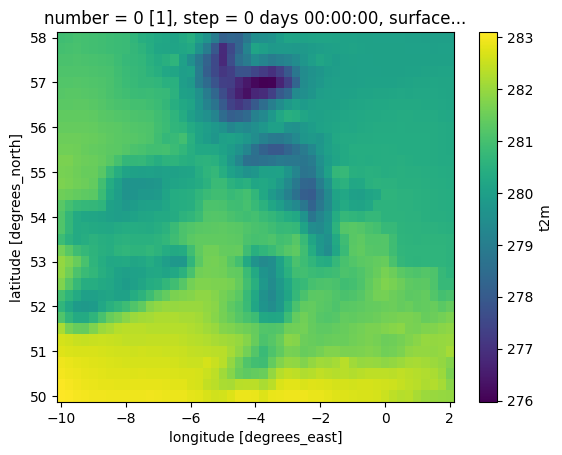
ds.t2m.mean(dim="time").plot(x="longitude")
<matplotlib.collections.QuadMesh at 0x151bb8910>
ds.sel(time="2019-03-10")
<xarray.Dataset> Size: 156kB
Dimensions:     (time: 24, latitude: 33, longitude: 49)
Coordinates:
    number      int64 8B ...
  * time        (time) datetime64[ns] 192B 2019-03-10 ... 2019-03-10T23:00:00
    step        timedelta64[ns] 8B ...
    surface     float64 8B ...
  * latitude    (latitude) float64 264B 58.0 57.75 57.5 ... 50.5 50.25 50.0
  * longitude   (longitude) float64 392B -10.0 -9.75 -9.5 -9.25 ... 1.5 1.75 2.0
    valid_time  (time) datetime64[ns] 192B ...
Data variables:
    t2m         (time, latitude, longitude) float32 155kB 278.3 278.5 ... 279.0
Attributes:
    GRIB_edition:            1
    GRIB_centre:             ecmf
    GRIB_centreDescription:  European Centre for Medium-Range Weather Forecasts
    GRIB_subCentre:          0
    Conventions:             CF-1.7
    institution:             European Centre for Medium-Range Weather Forecasts
history: 2025-06-23T11:08 GRIB to CDM+CF via cfgrib-0.9.1...ds.sel(time=slice("2019-03-02", "2019-03-04"))
<xarray.Dataset> Size: 468kB
Dimensions:     (time: 72, latitude: 33, longitude: 49)
Coordinates:
    number      int64 8B ...
  * time        (time) datetime64[ns] 576B 2019-03-02 ... 2019-03-04T23:00:00
    step        timedelta64[ns] 8B ...
    surface     float64 8B ...
  * latitude    (latitude) float64 264B 58.0 57.75 57.5 ... 50.5 50.25 50.0
  * longitude   (longitude) float64 392B -10.0 -9.75 -9.5 -9.25 ... 1.5 1.75 2.0
    valid_time  (time) datetime64[ns] 576B ...
Data variables:
    t2m         (time, latitude, longitude) float32 466kB 281.7 281.8 ... 278.5
Attributes:
    GRIB_edition:            1
    GRIB_centre:             ecmf
    GRIB_centreDescription:  European Centre for Medium-Range Weather Forecasts
    GRIB_subCentre:          0
    Conventions:             CF-1.7
    institution:             European Centre for Medium-Range Weather Forecasts
history: 2025-06-23T11:08 GRIB to CDM+CF via cfgrib-0.9.1...ds.sel(longitude=58.5, method="nearest")
<xarray.Dataset> Size: 110kB
Dimensions:     (time: 744, latitude: 33)
Coordinates:
    number      int64 8B ...
  * time        (time) datetime64[ns] 6kB 2019-03-01 ... 2019-03-31T23:00:00
    step        timedelta64[ns] 8B ...
    surface     float64 8B ...
  * latitude    (latitude) float64 264B 58.0 57.75 57.5 ... 50.5 50.25 50.0
    longitude   float64 8B 2.0
    valid_time  (time) datetime64[ns] 6kB ...
Data variables:
    t2m         (time, latitude) float32 98kB 279.4 279.3 279.2 ... 281.3 281.5
Attributes:
    GRIB_edition:            1
    GRIB_centre:             ecmf
    GRIB_centreDescription:  European Centre for Medium-Range Weather Forecasts
    GRIB_subCentre:          0
    Conventions:             CF-1.7
    institution:             European Centre for Medium-Range Weather Forecasts
history: 2025-06-23T11:08 GRIB to CDM+CF via cfgrib-0.9.1...ds.t2m.data[0,0,0]
np.float32(282.4248)
ds.t2m.isel(time = 0, latitude = 0, longitude = 0)
<xarray.DataArray 't2m' ()> Size: 4B
array(282.4248, dtype=float32)
Coordinates:
    number      int64 8B ...
    time        datetime64[ns] 8B 2019-03-01
    step        timedelta64[ns] 8B ...
    surface     float64 8B ...
    latitude    float64 8B 58.0
    longitude   float64 8B -10.0
    valid_time  datetime64[ns] 8B ...
Attributes: (12/32)
    GRIB_paramId:                             167
    GRIB_dataType:                            an
    GRIB_numberOfPoints:                      1617
    GRIB_typeOfLevel:                         surface
    GRIB_stepUnits:                           1
    GRIB_stepType:                            instant
    ...                                       ...
    GRIB_totalNumber:                         0
    GRIB_units:                               K
    long_name:                                2 metre temperature
    units:                                    K
    standard_name:                            unknown
meditwin: mediterranean twin summer schoolds.groupby("time.day")
<DatasetGroupBy, grouped over 1 grouper(s), 31 groups in total:
    'day': 31/31 groups present with labels 1, 2, 3, 4, 5, 6, ..., 27, 28, 29, 30, 31>
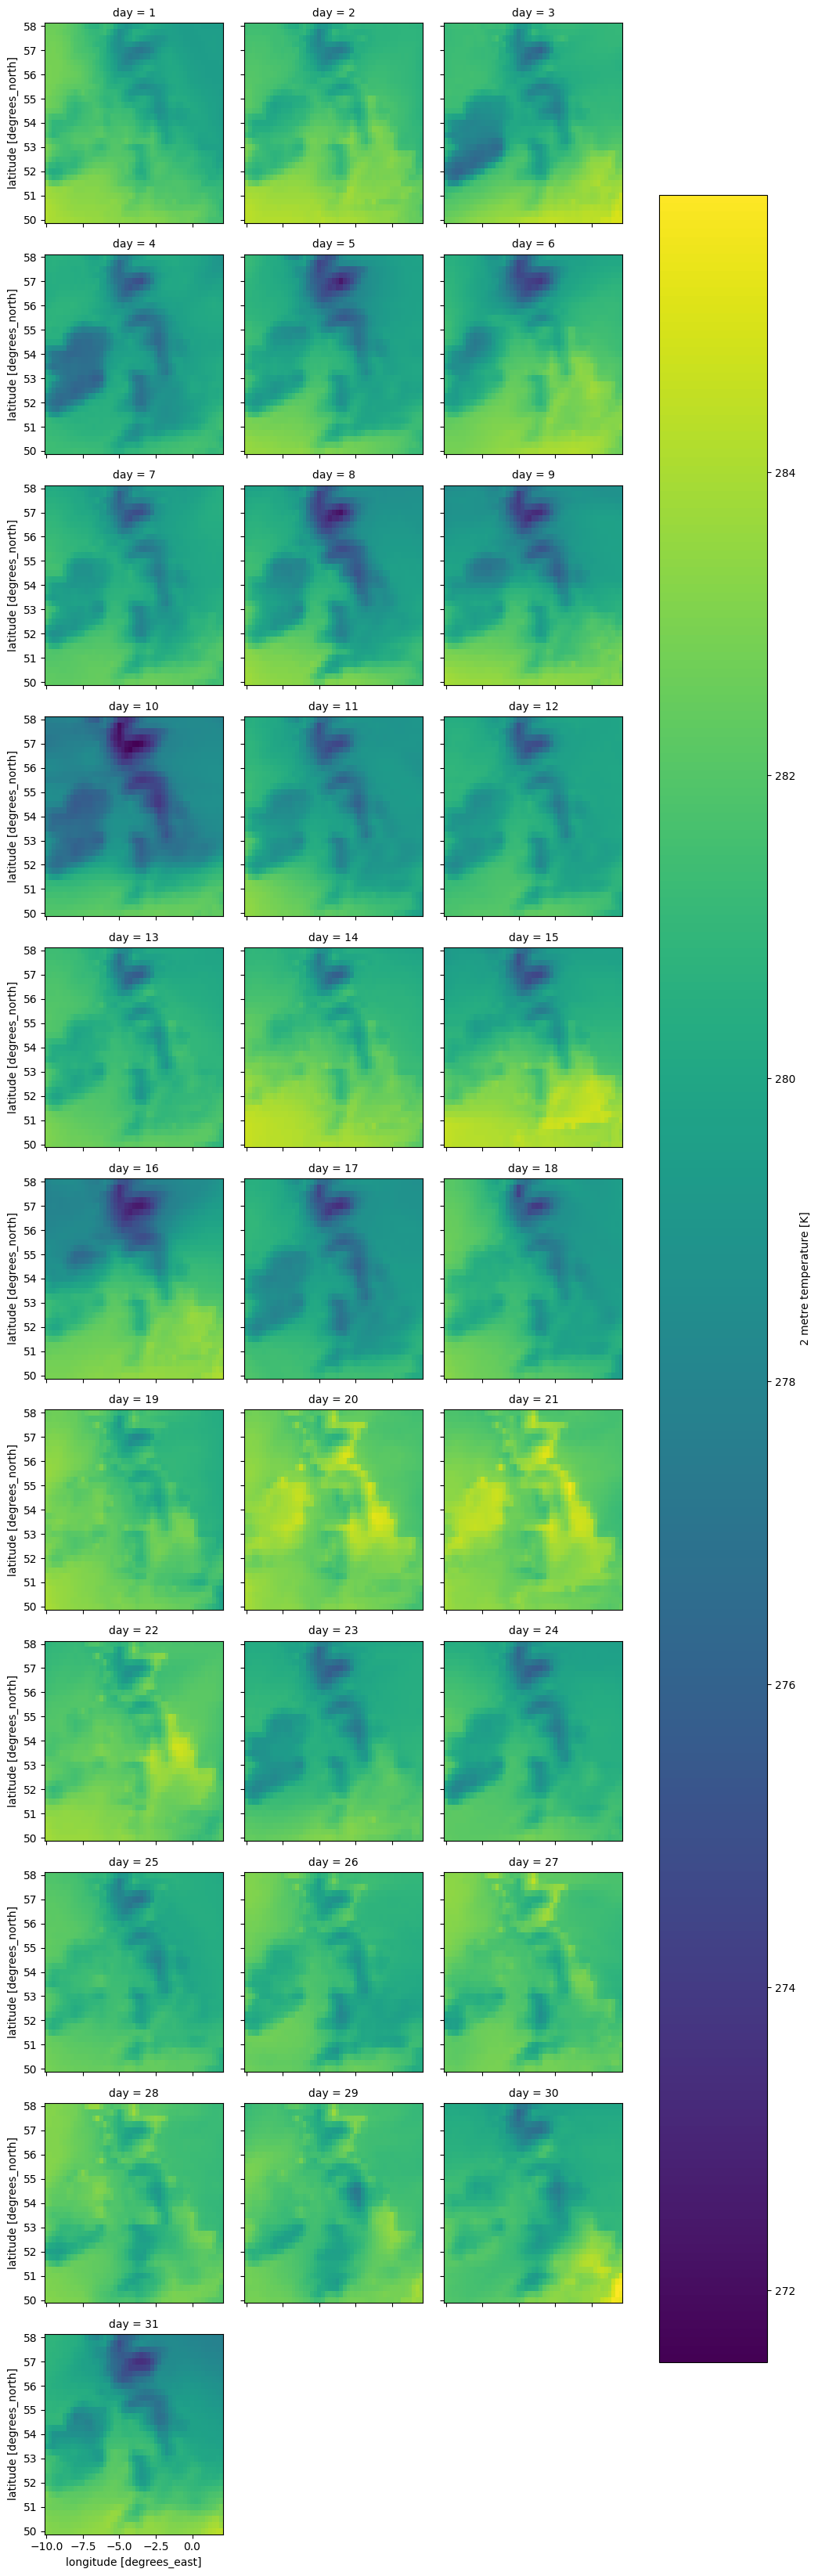
daily_mean = ds.groupby("time.day").mean()
daily_mean
<xarray.Dataset> Size: 201kB
Dimensions:    (day: 31, latitude: 33, longitude: 49)
Coordinates:
    number     int64 8B 0
    step       timedelta64[ns] 8B 00:00:00
    surface    float64 8B 0.0
  * latitude   (latitude) float64 264B 58.0 57.75 57.5 57.25 ... 50.5 50.25 50.0
  * longitude  (longitude) float64 392B -10.0 -9.75 -9.5 -9.25 ... 1.5 1.75 2.0
  * day        (day) int64 248B 1 2 3 4 5 6 7 8 9 ... 23 24 25 26 27 28 29 30 31
Data variables:
    t2m        (day, latitude, longitude) float32 201kB 282.6 282.6 ... 284.3
Attributes:
    GRIB_edition:            1
    GRIB_centre:             ecmf
    GRIB_centreDescription:  European Centre for Medium-Range Weather Forecasts
    GRIB_subCentre:          0
    Conventions:             CF-1.7
    institution:             European Centre for Medium-Range Weather Forecasts
history: 2025-06-23T11:08 GRIB to CDM+CF via cfgrib-0.9.1...daily_mean.t2m.plot(col="day", col_wrap=3, cmap="viridis")
<xarray.plot.facetgrid.FacetGrid at 0x1517397f0>
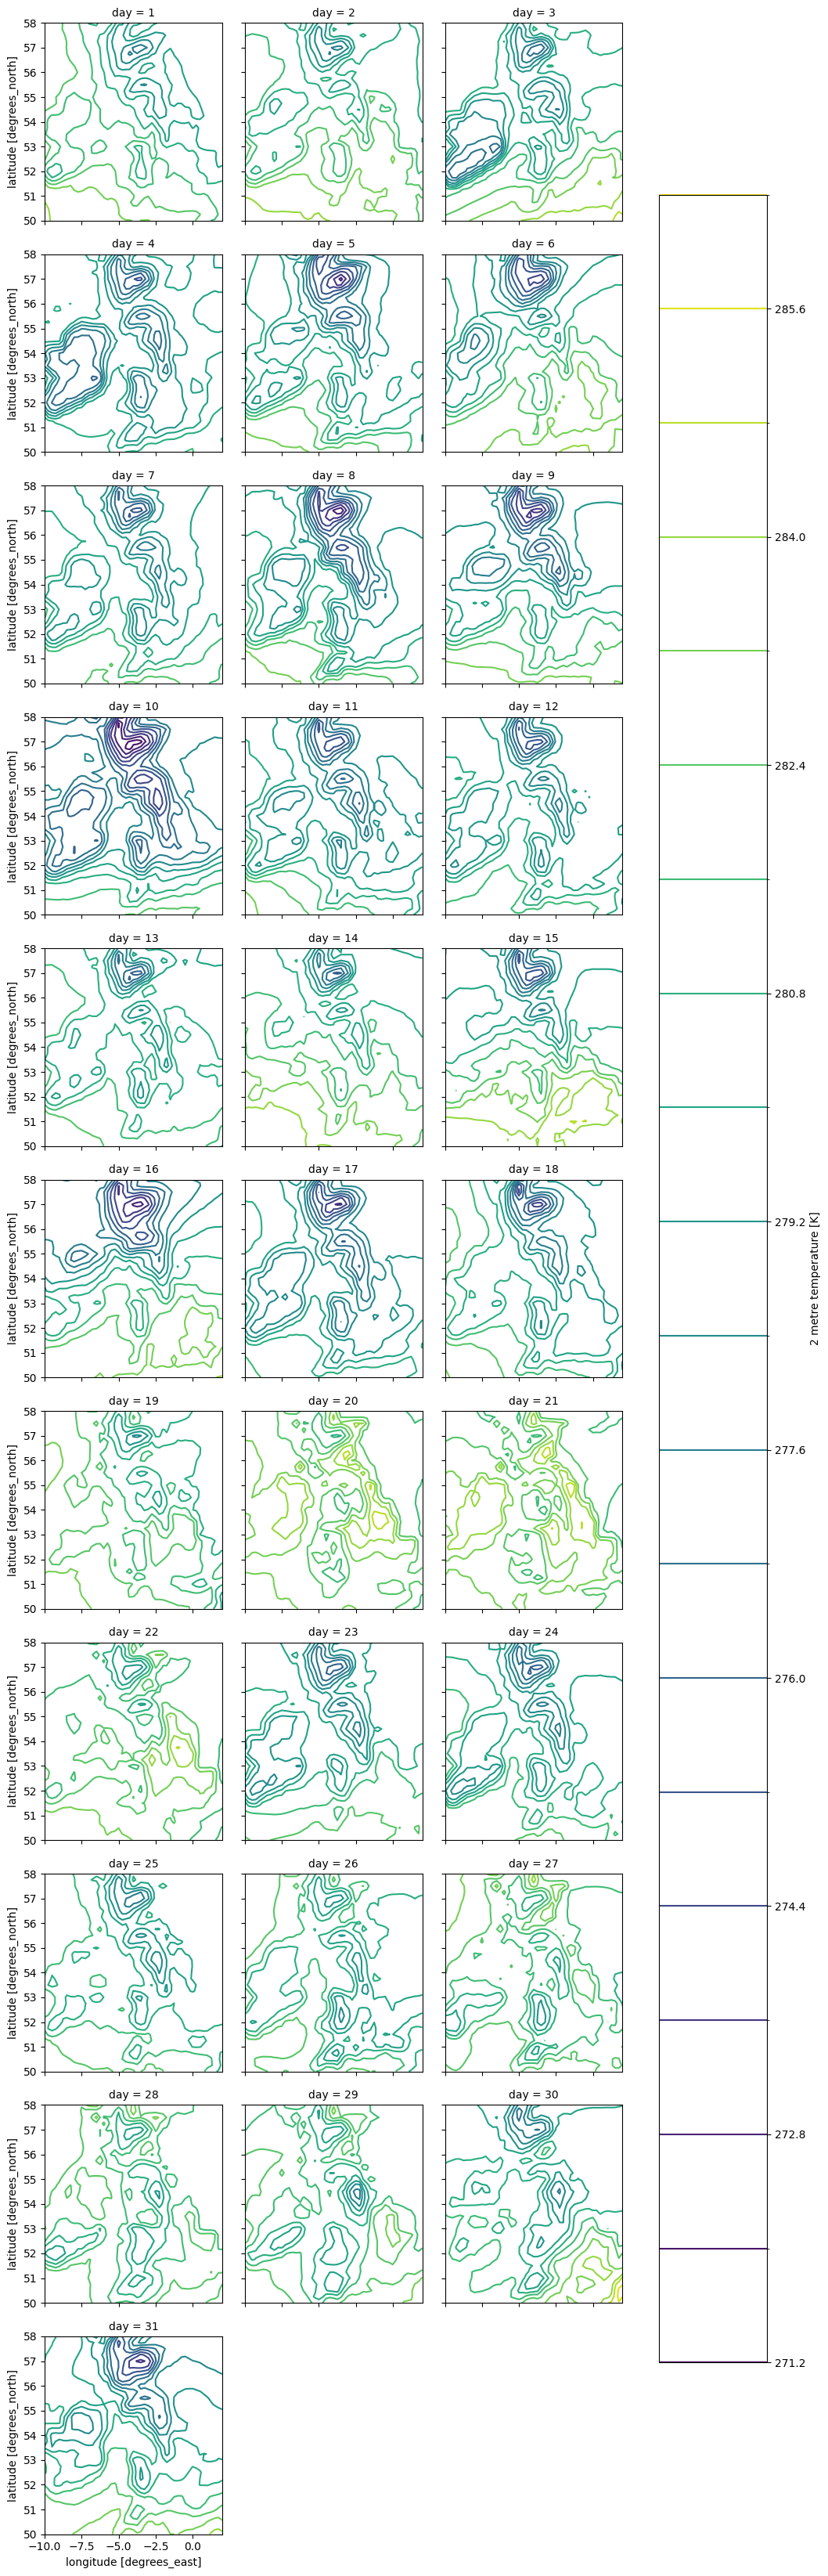
daily_mean.t2m.plot.contour(col="day",col_wrap=3, cmap="viridis",levels=20,add_colorbar=True)
<xarray.plot.facetgrid.FacetGrid at 0x1537dad50>
Xarray Read and Write#
ds.to_netcdf("../data/era5-test-data.nc")
ds = xr.open_dataset("../data/era5-test-data.nc")
ds
/var/folders/j3/513qxyhx4l30byl48tz1k1jr0000gn/T/ipykernel_70205/1144642969.py:1: FutureWarning: In a future version of xarray decode_timedelta will default to False rather than None. To silence this warning, set decode_timedelta to True, False, or a 'CFTimedeltaCoder' instance.
  ds = xr.open_dataset("../data/era5-test-data.nc")
<xarray.Dataset> Size: 5MB
Dimensions:     (time: 744, latitude: 33, longitude: 49)
Coordinates:
    number      int64 8B ...
  * time        (time) datetime64[ns] 6kB 2019-03-01 ... 2019-03-31T23:00:00
    step        timedelta64[ns] 8B ...
    surface     float64 8B ...
  * latitude    (latitude) float64 264B 58.0 57.75 57.5 ... 50.5 50.25 50.0
  * longitude   (longitude) float64 392B -10.0 -9.75 -9.5 -9.25 ... 1.5 1.75 2.0
    valid_time  (time) datetime64[ns] 6kB ...
Data variables:
    t2m         (time, latitude, longitude) float32 5MB ...
Attributes:
    GRIB_edition:            1
    GRIB_centre:             ecmf
    GRIB_centreDescription:  European Centre for Medium-Range Weather Forecasts
    GRIB_subCentre:          0
    Conventions:             CF-1.7
    institution:             European Centre for Medium-Range Weather Forecasts
    history:                 2025-06-23T11:08 GRIB to CDM+CF via cfgrib-0.9.1...