Download Data from CDSE STAC API As a DataCube Using STACSTACK#
Notebook Description#
This Jupyter Notebook demonstrates how to download and process Sentinel-2 L2A satellite imagery data from the Copernicus Data Space Ecosystem (CDSE) STAC API. The notebook provides a step-by-step guide to querying, retrieving, and visualizing geospatial data as a datacube using the stackstac library.
Key Steps#
Library Imports:
Utilizes libraries such as
pystac_client,stackstac,geopandas,shapely,rasterio, anddaskfor geospatial data processing and visualization.
Environment Setup:
Configures API URLs and AWS S3 credentials using environment variables for secure access to the CDSE STAC API.
STAC Client Initialization:
Demonstrates how to connect to the CDSE STAC API and enable item search functionality.
Data Search:
Queries the Sentinel-2 L2A collection for satellite imagery based on spatial (bounding box), temporal (date range), and cloud cover filters.
Bounding Box Creation:
Creates a bounding box around a point of interest and reprojects it to the appropriate coordinate reference system (CRS).
Datacube Retrieval:
Uses the
stackstaclibrary to retrieve and process the datacube, specifying desired bands, resolution, and resampling methods.
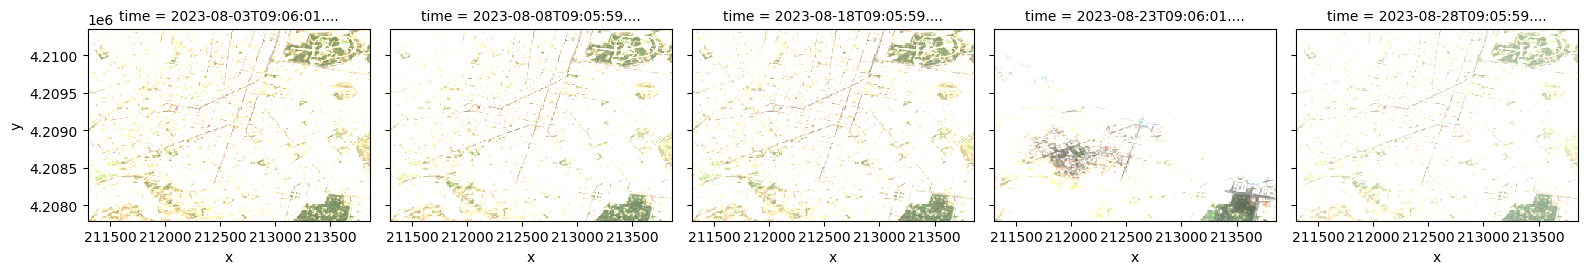
Visualization:
Visualizes the RGB bands of the datacube as images for visual inspection.
Use Case#
This notebook is ideal for users who want to:
Access and process Sentinel-2 satellite imagery from the Copernicus Data Space Ecosystem.
Learn how to use the
stackstaclibrary for creating datacubes.Visualize geospatial data for analysis and interpretation.
Prerequisites#
Create an account on the Copernicus Data Space Ecosystem.
Generate S3 Access Key and Secret Key.
Import the required libraries#
import os
import geopandas as gpd
import pandas as pd
from shapely import Point
from pystac_client import Client
import stackstac
from rasterio.enums import Resampling
import os
from rasterio.session import AWSSession
import dask
from dotenv import load_dotenv
load_dotenv("../.env")
dask.config.set(scheduler="single-threaded")
<dask.config.set at 0x12f7bc550>
Define API URL and ENV variables for S3 storage#
BASE_URL = "https://stac.dataspace.copernicus.eu/v1/" # new version
# BASE_URL = "https://catalogue.dataspace.copernicus.eu/stac"
ACCESS_KEY = os.getenv("ACCESS_KEY")
SECRET_KEY = os.getenv("SECRET_KEY")
CDSE_ENDPOINT = "eodata.dataspace.copernicus.eu"
os.environ["GDAL_HTTP_TCP_KEEPALIVE"] = "YES"
os.environ["AWS_S3_ENDPOINT"] = CDSE_ENDPOINT
os.environ["AWS_ACCESS_KEY_ID"] = ACCESS_KEY
os.environ["AWS_SECRET_ACCESS_KEY"] = SECRET_KEY
os.environ["AWS_HTTPS"] = "YES"
os.environ["AWS_VIRTUAL_HOSTING"] = "FALSE"
os.environ["GDAL_HTTP_UNSAFESSL"] = "YES"
os.environ["GDAL_SKIP"]="netCDF"
Initiate STAC client catalouge#
client = Client.open(BASE_URL)
client.add_conforms_to("ITEM_SEARCH")
Search Sentinel-2-L2A collection for images#
# Define the bounding box
lat, lon = 37.9838, 23.7275
# Search for Sentinel-2 L2A items based on the bounding box and cloud cover criteria
search = client.search(
    collections=["sentinel-2-l2a"],
    bbox=(lon - 1e-5, lat - 1e-5, lon + 1e-5, lat + 1e-5),
    datetime="2023-08-01/2023-08-30",
    query={"eo:cloud_cover": {"lt": 20}},
)

# Process the search results and select unique items based on acquisition date
all_items = list(search.items())
unique_items = {}
for item in all_items:
    acq_date = item.datetime.date()
    if acq_date not in unique_items:
        unique_items[acq_date] = item

# Sort the items by their acquisition date
items = list(unique_items.values())
items = sorted(items, key=lambda item: item.datetime)
items[0]
- type "Feature"
- stac_version "1.1.0"
stac_extensions[] 15 items
- 0 "https://cs-si.github.io/eopf-stac-extension/v1.2.0/schema.json"
- 1 "https://stac-extensions.github.io/alternate-assets/v1.2.0/schema.json"
- 2 "https://stac-extensions.github.io/authentication/v1.1.0/schema.json"
- 3 "https://stac-extensions.github.io/classification/v2.0.0/schema.json"
- 4 "https://stac-extensions.github.io/eo/v2.0.0/schema.json"
- 5 "https://stac-extensions.github.io/file/v2.1.0/schema.json"
- 6 "https://stac-extensions.github.io/grid/v1.1.0/schema.json"
- 7 "https://stac-extensions.github.io/processing/v1.2.0/schema.json"
- 8 "https://stac-extensions.github.io/product/v0.1.0/schema.json"
- 9 "https://stac-extensions.github.io/projection/v2.0.0/schema.json"
- 10 "https://stac-extensions.github.io/raster/v2.0.0/schema.json"
- 11 "https://stac-extensions.github.io/sat/v1.1.0/schema.json"
- 12 "https://stac-extensions.github.io/storage/v2.0.0/schema.json"
- 13 "https://stac-extensions.github.io/timestamps/v1.1.0/schema.json"
- 14 "https://stac-extensions.github.io/view/v1.0.0/schema.json"
- id "S2A_MSIL2A_20230803T090601_N0510_R050_T35SKC_20241026T141345"
geometry
- type "Polygon"
coordinates[] 1 items
0[] 5 items
0[] 2 items
- 0 23.545497035913204
- 1 38.797894647715
1[] 2 items
- 0 24.808652743577326
- 1 38.82843976082239
2[] 2 items
- 0 24.838247804919654
- 1 37.83959549435291
3[] 2 items
- 0 23.59208533856415
- 1 37.81010790673744
4[] 2 items
- 0 23.545497035913204
- 1 38.797894647715
bbox[] 4 items
- 0 23.545497035913204
- 1 37.81010790673744
- 2 24.838247804919654
- 3 38.82843976082239
properties
- gsd 10
- created "2025-02-19T16:06:51.219000Z"
- updated "2025-03-14T22:56:06.570284Z"
- datetime "2023-08-03T09:06:01.024000Z"
- platform "sentinel-2a"
- grid:code "MGRS-35SKC"
proj:bbox[] 4 items
- 0 23.545497035913204
- 1 37.81010790673744
- 2 24.838247804919654
- 3 38.82843976082239
- published "2025-03-14T22:56:06.570284Z"
statistics
- water 59.716868
- nodata 0.0
- dark_area 0.11092900000000001
- vegetation 16.675684
- thin_cirrus 0.000206
- cloud_shadow 0.148264
- unclassified 0.034555
- not_vegetated 23.095714
- high_proba_clouds 0.083643
- medium_proba_clouds 0.133948
- saturated_defective 0.0
instruments[] 1 items
- 0 "msi"
auth:schemes
s3
- type "s3"
oidc
- type "openIdConnect"
- openIdConnectUrl "https://identity.dataspace.copernicus.eu/auth/realms/CDSE/.well-known/openid-configuration"
- end_datetime "2023-08-03T09:06:01.024Z"
- product:type "S2MSI2A"
- view:azimuth 154.85886702765234
- constellation "sentinel-2"
- eo:snow_cover 0.0
- eo:cloud_cover 0.22
- start_datetime "2023-08-03T09:06:01.024Z"
- sat:orbit_state "descending"
storage:schemes
cdse-s3
- type "custom-s3"
- title "Copernicus Data Space Ecosystem S3"
- platform "https://eodata.dataspace.copernicus.eu"
- description "This endpoint provides access to EO data which is stored on the Object Storage. A Global Service Load Balancer (GSLB) directs the request to either CloudFerro Cloud or OpenTelekom Cloud (OTC) S3 endpoint based on the location of the DNS resolver."
- requester_pays False
creodias-s3
- type "custom-s3"
- title "CREODIAS S3"
- platform "https://eodata.cloudferro.com"
- description "Comprehensive Earth Observation Data (EODATA) archive offered by CREODIAS as a commercial part of CDSE, designed to provide users with access to a vast repository of satellite data without predefined quota limits"
- requester_pays True
- eopf:datatake_id "GS2A_20230803T090601_042375_N05.10"
- processing:level "L2"
- view:sun_azimuth 139.036965342159
- eopf:datastrip_id "S2A_OPER_MSI_L2A_DS_S2RP_20241026T141345_S20230803T091014_N05.10"
- processing:version "05.10"
- product:timeliness "PT24H"
- sat:absolute_orbit 42375
- sat:relative_orbit 50
- view:sun_elevation 64.24338183169431
- processing:datetime "2024-10-26T14:13:45.000000Z"
- processing:facility "ESA"
- eopf:instrument_mode "INS-NOBS"
- eopf:origin_datetime "2025-02-19T16:06:51.219000Z"
- view:incidence_angle 2.9233655979001454
- product:timeliness_category "NRT"
- sat:platform_international_designator "2015-028A"
links[] 5 items
0
- rel "collection"
- href "https://stac.dataspace.copernicus.eu/v1/collections/sentinel-2-l2a"
- type "application/json"
1
- rel "parent"
- href "https://stac.dataspace.copernicus.eu/v1/collections/sentinel-2-l2a"
- type "application/json"
2
- rel "root"
- href "https://stac.dataspace.copernicus.eu/v1/"
- type "application/json"
- title "Copernicus Data Space Ecosystem (CDSE) asset-level STAC catalogue"
3
- rel "self"
- href "https://stac.dataspace.copernicus.eu/v1/collections/sentinel-2-l2a/items/S2A_MSIL2A_20230803T090601_N0510_R050_T35SKC_20241026T141345"
- type "application/geo+json"
4
- rel "version-history"
- href "https://trace.dataspace.copernicus.eu/api/v1/traces/name/S2A_MSIL2A_20230803T090601_N0510_R050_T35SKC_20241026T141345.SAFE.zip"
- type "application/json"
- title "Product history record from the CDSE traceability service"
assets
AOT_10m
- href "s3://eodata/Sentinel-2/MSI/L2A_N0500/2023/08/03/S2A_MSIL2A_20230803T090601_N0510_R050_T35SKC_20241026T141345.SAFE/GRANULE/L2A_T35SKC_A042375_20230803T091014/IMG_DATA/R10m/T35SKC_20230803T090601_AOT_10m.jp2"
- type "image/jp2"
- title "Aerosol optical thickness (AOT) - 10m"
alternate
https
- href "https://zipper.dataspace.copernicus.eu/odata/v1/Products(73b75ce5-a1d8-4607-8555-bcb6ea6c02ee)/Nodes(S2A_MSIL2A_20230803T090601_N0510_R050_T35SKC_20241026T141345.SAFE)/Nodes(GRANULE)/Nodes(L2A_T35SKC_A042375_20230803T091014)/Nodes(IMG_DATA)/Nodes(R10m)/Nodes(T35SKC_20230803T090601_AOT_10m.jp2)/$value"
auth:refs[] 1 items
- 0 "oidc"
- alternate:name "HTTPS"
- file:size 2135196
proj:bbox[] 4 items
- 0 199980
- 1 4190220
- 2 309780
- 3 4300020
- proj:code "EPSG:32635"
- file:checksum "1620528d49c75a02e95ed3d6c0b6e594a7dd7c67c0f7c6d6f223f16b98be51c190ec"
proj:transform[] 6 items
- 0 10
- 1 0
- 2 199980
- 3 0
- 4 -10
- 5 4300020
- file:local_path "S2A_MSIL2A_20230803T090601_N0510_R050_T35SKC_20241026T141345.SAFE/GRANULE/L2A_T35SKC_A042375_20230803T091014/IMG_DATA/R10m/T35SKC_20230803T090601_AOT_10m.jp2"
- gsd 10
- nodata 0
auth:refs[] 1 items
- 0 "s3"
- data_type "uint16"
proj:shape[] 2 items
- 0 10980
- 1 10980
- raster:scale 0.0001
storage:refs[] 2 items
- 0 "cdse-s3"
- 1 "creodias-s3"
- raster:offset -0.1
- alternate:name "S3"
roles[] 2 items
- 0 "data"
- 1 "gsd:10m"
AOT_20m
- href "s3://eodata/Sentinel-2/MSI/L2A_N0500/2023/08/03/S2A_MSIL2A_20230803T090601_N0510_R050_T35SKC_20241026T141345.SAFE/GRANULE/L2A_T35SKC_A042375_20230803T091014/IMG_DATA/R20m/T35SKC_20230803T090601_AOT_20m.jp2"
- type "image/jp2"
- title "Aerosol optical thickness (AOT) - 20m"
alternate
https
- href "https://zipper.dataspace.copernicus.eu/odata/v1/Products(73b75ce5-a1d8-4607-8555-bcb6ea6c02ee)/Nodes(S2A_MSIL2A_20230803T090601_N0510_R050_T35SKC_20241026T141345.SAFE)/Nodes(GRANULE)/Nodes(L2A_T35SKC_A042375_20230803T091014)/Nodes(IMG_DATA)/Nodes(R20m)/Nodes(T35SKC_20230803T090601_AOT_20m.jp2)/$value"
auth:refs[] 1 items
- 0 "oidc"
- alternate:name "HTTPS"
- file:size 1620174
proj:bbox[] 4 items
- 0 199980
- 1 4190220
- 2 309780
- 3 4300020
- proj:code "EPSG:32635"
- file:checksum "1620929150a51f1e5624f9456b99055b277d7fa4b5f404003d9c184792414401fd5b"
proj:transform[] 6 items
- 0 20
- 1 0
- 2 199980
- 3 0
- 4 -20
- 5 4300020
- file:local_path "S2A_MSIL2A_20230803T090601_N0510_R050_T35SKC_20241026T141345.SAFE/GRANULE/L2A_T35SKC_A042375_20230803T091014/IMG_DATA/R20m/T35SKC_20230803T090601_AOT_20m.jp2"
- gsd 20
- nodata 0
auth:refs[] 1 items
- 0 "s3"
- data_type "uint16"
proj:shape[] 2 items
- 0 5490
- 1 5490
- raster:scale 0.0001
storage:refs[] 2 items
- 0 "cdse-s3"
- 1 "creodias-s3"
- raster:offset -0.1
- alternate:name "S3"
roles[] 2 items
- 0 "data"
- 1 "gsd:20m"
AOT_60m
- href "s3://eodata/Sentinel-2/MSI/L2A_N0500/2023/08/03/S2A_MSIL2A_20230803T090601_N0510_R050_T35SKC_20241026T141345.SAFE/GRANULE/L2A_T35SKC_A042375_20230803T091014/IMG_DATA/R60m/T35SKC_20230803T090601_AOT_60m.jp2"
- type "image/jp2"
- title "Aerosol optical thickness (AOT) - 60m"
alternate
https
- href "https://zipper.dataspace.copernicus.eu/odata/v1/Products(73b75ce5-a1d8-4607-8555-bcb6ea6c02ee)/Nodes(S2A_MSIL2A_20230803T090601_N0510_R050_T35SKC_20241026T141345.SAFE)/Nodes(GRANULE)/Nodes(L2A_T35SKC_A042375_20230803T091014)/Nodes(IMG_DATA)/Nodes(R60m)/Nodes(T35SKC_20230803T090601_AOT_60m.jp2)/$value"
auth:refs[] 1 items
- 0 "oidc"
- alternate:name "HTTPS"
- file:size 396419
proj:bbox[] 4 items
- 0 199980
- 1 4190220
- 2 309780
- 3 4300020
- proj:code "EPSG:32635"
- file:checksum "162040986832654d7c999d34cdbadb0e071150f41d05328f4d48978d014628e6e62a"
proj:transform[] 6 items
- 0 60
- 1 0
- 2 199980
- 3 0
- 4 -60
- 5 4300020
- file:local_path "S2A_MSIL2A_20230803T090601_N0510_R050_T35SKC_20241026T141345.SAFE/GRANULE/L2A_T35SKC_A042375_20230803T091014/IMG_DATA/R60m/T35SKC_20230803T090601_AOT_60m.jp2"
- gsd 60
- nodata 0
auth:refs[] 1 items
- 0 "s3"
- data_type "uint16"
proj:shape[] 2 items
- 0 1830
- 1 1830
- raster:scale 0.0001
storage:refs[] 2 items
- 0 "cdse-s3"
- 1 "creodias-s3"
- raster:offset -0.1
- alternate:name "S3"
roles[] 2 items
- 0 "data"
- 1 "gsd:60m"
B01_20m
- href "s3://eodata/Sentinel-2/MSI/L2A_N0500/2023/08/03/S2A_MSIL2A_20230803T090601_N0510_R050_T35SKC_20241026T141345.SAFE/GRANULE/L2A_T35SKC_A042375_20230803T091014/IMG_DATA/R20m/T35SKC_20230803T090601_B01_20m.jp2"
- type "image/jp2"
- title "Coastal aerosol (band 1) - 20m"
bands[] 1 items
0
- description "Coastal aerosol (band 1)"
- eo:center_wavelength 0.443
- eo:full_width_half_max 0.228
- name "B01"
- eo:common_name "coastal"
alternate
https
- href "https://zipper.dataspace.copernicus.eu/odata/v1/Products(73b75ce5-a1d8-4607-8555-bcb6ea6c02ee)/Nodes(S2A_MSIL2A_20230803T090601_N0510_R050_T35SKC_20241026T141345.SAFE)/Nodes(GRANULE)/Nodes(L2A_T35SKC_A042375_20230803T091014)/Nodes(IMG_DATA)/Nodes(R20m)/Nodes(T35SKC_20230803T090601_B01_20m.jp2)/$value"
auth:refs[] 1 items
- 0 "oidc"
- alternate:name "HTTPS"
- file:size 18245163
proj:bbox[] 4 items
- 0 199980
- 1 4190220
- 2 309780
- 3 4300020
- proj:code "EPSG:32635"
- view:azimuth 153.06784179706
- file:checksum "1620d0bc60f2d344c523d3637e6d927e05e83f0896bec291c00591d0a3657e01f958"
proj:transform[] 6 items
- 0 20
- 1 0
- 2 199980
- 3 0
- 4 -20
- 5 4300020
- file:local_path "S2A_MSIL2A_20230803T090601_N0510_R050_T35SKC_20241026T141345.SAFE/GRANULE/L2A_T35SKC_A042375_20230803T091014/IMG_DATA/R20m/T35SKC_20230803T090601_B01_20m.jp2"
- view:incidence_angle 3.19679899325496
- gsd 20
- nodata 0
auth:refs[] 1 items
- 0 "s3"
- data_type "uint16"
proj:shape[] 2 items
- 0 5490
- 1 5490
- raster:scale 0.0001
storage:refs[] 2 items
- 0 "cdse-s3"
- 1 "creodias-s3"
- raster:offset -0.1
- alternate:name "S3"
roles[] 4 items
- 0 "data"
- 1 "reflectance"
- 2 "sampling:upsampled"
- 3 "gsd:20m"
B01_60m
- href "s3://eodata/Sentinel-2/MSI/L2A_N0500/2023/08/03/S2A_MSIL2A_20230803T090601_N0510_R050_T35SKC_20241026T141345.SAFE/GRANULE/L2A_T35SKC_A042375_20230803T091014/IMG_DATA/R60m/T35SKC_20230803T090601_B01_60m.jp2"
- type "image/jp2"
- title "Coastal aerosol (band 1) - 60m"
bands[] 1 items
0
- description "Coastal aerosol (band 1)"
- eo:center_wavelength 0.443
- eo:full_width_half_max 0.228
- name "B01"
- eo:common_name "coastal"
alternate
https
- href "https://zipper.dataspace.copernicus.eu/odata/v1/Products(73b75ce5-a1d8-4607-8555-bcb6ea6c02ee)/Nodes(S2A_MSIL2A_20230803T090601_N0510_R050_T35SKC_20241026T141345.SAFE)/Nodes(GRANULE)/Nodes(L2A_T35SKC_A042375_20230803T091014)/Nodes(IMG_DATA)/Nodes(R60m)/Nodes(T35SKC_20230803T090601_B01_60m.jp2)/$value"
auth:refs[] 1 items
- 0 "oidc"
- alternate:name "HTTPS"
- file:size 3638347
proj:bbox[] 4 items
- 0 199980
- 1 4190220
- 2 309780
- 3 4300020
- proj:code "EPSG:32635"
- view:azimuth 153.06784179706
- file:checksum "162087e6a201e5c43093db2035a88aa05ab6b03e7834803a818d81e1bd5080846041"
proj:transform[] 6 items
- 0 60
- 1 0
- 2 199980
- 3 0
- 4 -60
- 5 4300020
- file:local_path "S2A_MSIL2A_20230803T090601_N0510_R050_T35SKC_20241026T141345.SAFE/GRANULE/L2A_T35SKC_A042375_20230803T091014/IMG_DATA/R60m/T35SKC_20230803T090601_B01_60m.jp2"
- view:incidence_angle 3.19679899325496
- gsd 60
- nodata 0
auth:refs[] 1 items
- 0 "s3"
- data_type "uint16"
proj:shape[] 2 items
- 0 1830
- 1 1830
- raster:scale 0.0001
storage:refs[] 2 items
- 0 "cdse-s3"
- 1 "creodias-s3"
- raster:offset -0.1
- alternate:name "S3"
roles[] 4 items
- 0 "data"
- 1 "reflectance"
- 2 "sampling:original"
- 3 "gsd:60m"
B02_10m
- href "s3://eodata/Sentinel-2/MSI/L2A_N0500/2023/08/03/S2A_MSIL2A_20230803T090601_N0510_R050_T35SKC_20241026T141345.SAFE/GRANULE/L2A_T35SKC_A042375_20230803T091014/IMG_DATA/R10m/T35SKC_20230803T090601_B02_10m.jp2"
- type "image/jp2"
- title "Blue (band 2) - 10m"
bands[] 1 items
0
- description "Blue (band 2)"
- eo:center_wavelength 0.493
- eo:full_width_half_max 0.267
- name "B02"
- eo:common_name "blue"
alternate
https
- href "https://zipper.dataspace.copernicus.eu/odata/v1/Products(73b75ce5-a1d8-4607-8555-bcb6ea6c02ee)/Nodes(S2A_MSIL2A_20230803T090601_N0510_R050_T35SKC_20241026T141345.SAFE)/Nodes(GRANULE)/Nodes(L2A_T35SKC_A042375_20230803T091014)/Nodes(IMG_DATA)/Nodes(R10m)/Nodes(T35SKC_20230803T090601_B02_10m.jp2)/$value"
auth:refs[] 1 items
- 0 "oidc"
- alternate:name "HTTPS"
- file:size 116784015
proj:bbox[] 4 items
- 0 199980
- 1 4190220
- 2 309780
- 3 4300020
- proj:code "EPSG:32635"
- view:azimuth 159.148766576456
- file:checksum "16201c55b36b974b589bdadeed5ca8ea6e20510bffbd77d536e82f1f3c5b965a0dba"
proj:transform[] 6 items
- 0 10
- 1 0
- 2 199980
- 3 0
- 4 -10
- 5 4300020
- file:local_path "S2A_MSIL2A_20230803T090601_N0510_R050_T35SKC_20241026T141345.SAFE/GRANULE/L2A_T35SKC_A042375_20230803T091014/IMG_DATA/R10m/T35SKC_20230803T090601_B02_10m.jp2"
- view:incidence_angle 2.55514045690931
- gsd 10
- nodata 0
auth:refs[] 1 items
- 0 "s3"
- data_type "uint16"
proj:shape[] 2 items
- 0 10980
- 1 10980
- raster:scale 0.0001
storage:refs[] 2 items
- 0 "cdse-s3"
- 1 "creodias-s3"
- raster:offset -0.1
- alternate:name "S3"
roles[] 4 items
- 0 "data"
- 1 "reflectance"
- 2 "sampling:original"
- 3 "gsd:10m"
B02_20m
- href "s3://eodata/Sentinel-2/MSI/L2A_N0500/2023/08/03/S2A_MSIL2A_20230803T090601_N0510_R050_T35SKC_20241026T141345.SAFE/GRANULE/L2A_T35SKC_A042375_20230803T091014/IMG_DATA/R20m/T35SKC_20230803T090601_B02_20m.jp2"
- type "image/jp2"
- title "Blue (band 2) - 20m"
bands[] 1 items
0
- description "Blue (band 2)"
- eo:center_wavelength 0.493
- eo:full_width_half_max 0.267
- name "B02"
- eo:common_name "blue"
alternate
https
- href "https://zipper.dataspace.copernicus.eu/odata/v1/Products(73b75ce5-a1d8-4607-8555-bcb6ea6c02ee)/Nodes(S2A_MSIL2A_20230803T090601_N0510_R050_T35SKC_20241026T141345.SAFE)/Nodes(GRANULE)/Nodes(L2A_T35SKC_A042375_20230803T091014)/Nodes(IMG_DATA)/Nodes(R20m)/Nodes(T35SKC_20230803T090601_B02_20m.jp2)/$value"
auth:refs[] 1 items
- 0 "oidc"
- alternate:name "HTTPS"
- file:size 31617926
proj:bbox[] 4 items
- 0 199980
- 1 4190220
- 2 309780
- 3 4300020
- proj:code "EPSG:32635"
- view:azimuth 159.148766576456
- file:checksum "1620440e52fb29a7137be4059398c63f6f77c04e4977fc39081c2b093fe59ad6bc3f"
proj:transform[] 6 items
- 0 20
- 1 0
- 2 199980
- 3 0
- 4 -20
- 5 4300020
- file:local_path "S2A_MSIL2A_20230803T090601_N0510_R050_T35SKC_20241026T141345.SAFE/GRANULE/L2A_T35SKC_A042375_20230803T091014/IMG_DATA/R20m/T35SKC_20230803T090601_B02_20m.jp2"
- view:incidence_angle 2.55514045690931
- gsd 20
- nodata 0
auth:refs[] 1 items
- 0 "s3"
- data_type "uint16"
proj:shape[] 2 items
- 0 5490
- 1 5490
- raster:scale 0.0001
storage:refs[] 2 items
- 0 "cdse-s3"
- 1 "creodias-s3"
- raster:offset -0.1
- alternate:name "S3"
roles[] 4 items
- 0 "data"
- 1 "reflectance"
- 2 "sampling:downsampled"
- 3 "gsd:20m"
B02_60m
- href "s3://eodata/Sentinel-2/MSI/L2A_N0500/2023/08/03/S2A_MSIL2A_20230803T090601_N0510_R050_T35SKC_20241026T141345.SAFE/GRANULE/L2A_T35SKC_A042375_20230803T091014/IMG_DATA/R60m/T35SKC_20230803T090601_B02_60m.jp2"
- type "image/jp2"
- title "Blue (band 2) - 60m"
bands[] 1 items
0
- description "Blue (band 2)"
- eo:center_wavelength 0.493
- eo:full_width_half_max 0.267
- name "B02"
- eo:common_name "blue"
alternate
https
- href "https://zipper.dataspace.copernicus.eu/odata/v1/Products(73b75ce5-a1d8-4607-8555-bcb6ea6c02ee)/Nodes(S2A_MSIL2A_20230803T090601_N0510_R050_T35SKC_20241026T141345.SAFE)/Nodes(GRANULE)/Nodes(L2A_T35SKC_A042375_20230803T091014)/Nodes(IMG_DATA)/Nodes(R60m)/Nodes(T35SKC_20230803T090601_B02_60m.jp2)/$value"
auth:refs[] 1 items
- 0 "oidc"
- alternate:name "HTTPS"
- file:size 3764827
proj:bbox[] 4 items
- 0 199980
- 1 4190220
- 2 309780
- 3 4300020
- proj:code "EPSG:32635"
- view:azimuth 159.148766576456
- file:checksum "162034971650006e7bf29f104849250dfa785d5e82fc9b03dda7dd222092a4f0ce76"
proj:transform[] 6 items
- 0 60
- 1 0
- 2 199980
- 3 0
- 4 -60
- 5 4300020
- file:local_path "S2A_MSIL2A_20230803T090601_N0510_R050_T35SKC_20241026T141345.SAFE/GRANULE/L2A_T35SKC_A042375_20230803T091014/IMG_DATA/R60m/T35SKC_20230803T090601_B02_60m.jp2"
- view:incidence_angle 2.55514045690931
- gsd 60
- nodata 0
auth:refs[] 1 items
- 0 "s3"
- data_type "uint16"
proj:shape[] 2 items
- 0 1830
- 1 1830
- raster:scale 0.0001
storage:refs[] 2 items
- 0 "cdse-s3"
- 1 "creodias-s3"
- raster:offset -0.1
- alternate:name "S3"
roles[] 4 items
- 0 "data"
- 1 "reflectance"
- 2 "sampling:downsampled"
- 3 "gsd:60m"
B03_10m
- href "s3://eodata/Sentinel-2/MSI/L2A_N0500/2023/08/03/S2A_MSIL2A_20230803T090601_N0510_R050_T35SKC_20241026T141345.SAFE/GRANULE/L2A_T35SKC_A042375_20230803T091014/IMG_DATA/R10m/T35SKC_20230803T090601_B03_10m.jp2"
- type "image/jp2"
- title "Green (band 3) - 10m"
bands[] 1 items
0
- description "Green (band 3)"
- eo:center_wavelength 0.56
- eo:full_width_half_max 0.291
- name "B03"
- eo:common_name "green"
alternate
https
- href "https://zipper.dataspace.copernicus.eu/odata/v1/Products(73b75ce5-a1d8-4607-8555-bcb6ea6c02ee)/Nodes(S2A_MSIL2A_20230803T090601_N0510_R050_T35SKC_20241026T141345.SAFE)/Nodes(GRANULE)/Nodes(L2A_T35SKC_A042375_20230803T091014)/Nodes(IMG_DATA)/Nodes(R10m)/Nodes(T35SKC_20230803T090601_B03_10m.jp2)/$value"
auth:refs[] 1 items
- 0 "oidc"
- alternate:name "HTTPS"
- file:size 113713966
proj:bbox[] 4 items
- 0 199980
- 1 4190220
- 2 309780
- 3 4300020
- proj:code "EPSG:32635"
- view:azimuth 156.748839949368
- file:checksum "16202dd210243ea6c2d6f068e517d131c692b7d0328469ad96dc7378485cefda6b8a"
proj:transform[] 6 items
- 0 10
- 1 0
- 2 199980
- 3 0
- 4 -10
- 5 4300020
- file:local_path "S2A_MSIL2A_20230803T090601_N0510_R050_T35SKC_20241026T141345.SAFE/GRANULE/L2A_T35SKC_A042375_20230803T091014/IMG_DATA/R10m/T35SKC_20230803T090601_B03_10m.jp2"
- view:incidence_angle 2.66333167529336
- gsd 10
- nodata 0
auth:refs[] 1 items
- 0 "s3"
- data_type "uint16"
proj:shape[] 2 items
- 0 10980
- 1 10980
- raster:scale 0.0001
storage:refs[] 2 items
- 0 "cdse-s3"
- 1 "creodias-s3"
- raster:offset -0.1
- alternate:name "S3"
roles[] 4 items
- 0 "data"
- 1 "reflectance"
- 2 "sampling:original"
- 3 "gsd:10m"
B03_20m
- href "s3://eodata/Sentinel-2/MSI/L2A_N0500/2023/08/03/S2A_MSIL2A_20230803T090601_N0510_R050_T35SKC_20241026T141345.SAFE/GRANULE/L2A_T35SKC_A042375_20230803T091014/IMG_DATA/R20m/T35SKC_20230803T090601_B03_20m.jp2"
- type "image/jp2"
- title "Green (band 3) - 20m"
bands[] 1 items
0
- description "Green (band 3)"
- eo:center_wavelength 0.56
- eo:full_width_half_max 0.291
- name "B03"
- eo:common_name "green"
alternate
https
- href "https://zipper.dataspace.copernicus.eu/odata/v1/Products(73b75ce5-a1d8-4607-8555-bcb6ea6c02ee)/Nodes(S2A_MSIL2A_20230803T090601_N0510_R050_T35SKC_20241026T141345.SAFE)/Nodes(GRANULE)/Nodes(L2A_T35SKC_A042375_20230803T091014)/Nodes(IMG_DATA)/Nodes(R20m)/Nodes(T35SKC_20230803T090601_B03_20m.jp2)/$value"
auth:refs[] 1 items
- 0 "oidc"
- alternate:name "HTTPS"
- file:size 31104401
proj:bbox[] 4 items
- 0 199980
- 1 4190220
- 2 309780
- 3 4300020
- proj:code "EPSG:32635"
- view:azimuth 156.748839949368
- file:checksum "162051adef840bc3e7330b39feddc3ffe2f020070a575601f8c63c4a3104306b5730"
proj:transform[] 6 items
- 0 20
- 1 0
- 2 199980
- 3 0
- 4 -20
- 5 4300020
- file:local_path "S2A_MSIL2A_20230803T090601_N0510_R050_T35SKC_20241026T141345.SAFE/GRANULE/L2A_T35SKC_A042375_20230803T091014/IMG_DATA/R20m/T35SKC_20230803T090601_B03_20m.jp2"
- view:incidence_angle 2.66333167529336
- gsd 20
- nodata 0
auth:refs[] 1 items
- 0 "s3"
- data_type "uint16"
proj:shape[] 2 items
- 0 5490
- 1 5490
- raster:scale 0.0001
storage:refs[] 2 items
- 0 "cdse-s3"
- 1 "creodias-s3"
- raster:offset -0.1
- alternate:name "S3"
roles[] 4 items
- 0 "data"
- 1 "reflectance"
- 2 "sampling:downsampled"
- 3 "gsd:20m"
B03_60m
- href "s3://eodata/Sentinel-2/MSI/L2A_N0500/2023/08/03/S2A_MSIL2A_20230803T090601_N0510_R050_T35SKC_20241026T141345.SAFE/GRANULE/L2A_T35SKC_A042375_20230803T091014/IMG_DATA/R60m/T35SKC_20230803T090601_B03_60m.jp2"
- type "image/jp2"
- title "Green (band 3) - 60m"
bands[] 1 items
0
- description "Green (band 3)"
- eo:center_wavelength 0.56
- eo:full_width_half_max 0.291
- name "B03"
- eo:common_name "green"
alternate
https
- href "https://zipper.dataspace.copernicus.eu/odata/v1/Products(73b75ce5-a1d8-4607-8555-bcb6ea6c02ee)/Nodes(S2A_MSIL2A_20230803T090601_N0510_R050_T35SKC_20241026T141345.SAFE)/Nodes(GRANULE)/Nodes(L2A_T35SKC_A042375_20230803T091014)/Nodes(IMG_DATA)/Nodes(R60m)/Nodes(T35SKC_20230803T090601_B03_60m.jp2)/$value"
auth:refs[] 1 items
- 0 "oidc"
- alternate:name "HTTPS"
- file:size 3769546
proj:bbox[] 4 items
- 0 199980
- 1 4190220
- 2 309780
- 3 4300020
- proj:code "EPSG:32635"
- view:azimuth 156.748839949368
- file:checksum "1620e2262bb125da7df0595ef56cdbab16c44bb3810d55c159496b03b36ffadaaa86"
proj:transform[] 6 items
- 0 60
- 1 0
- 2 199980
- 3 0
- 4 -60
- 5 4300020
- file:local_path "S2A_MSIL2A_20230803T090601_N0510_R050_T35SKC_20241026T141345.SAFE/GRANULE/L2A_T35SKC_A042375_20230803T091014/IMG_DATA/R60m/T35SKC_20230803T090601_B03_60m.jp2"
- view:incidence_angle 2.66333167529336
- gsd 60
- nodata 0
auth:refs[] 1 items
- 0 "s3"
- data_type "uint16"
proj:shape[] 2 items
- 0 1830
- 1 1830
- raster:scale 0.0001
storage:refs[] 2 items
- 0 "cdse-s3"
- 1 "creodias-s3"
- raster:offset -0.1
- alternate:name "S3"
roles[] 4 items
- 0 "data"
- 1 "reflectance"
- 2 "sampling:downsampled"
- 3 "gsd:60m"
B04_10m
- href "s3://eodata/Sentinel-2/MSI/L2A_N0500/2023/08/03/S2A_MSIL2A_20230803T090601_N0510_R050_T35SKC_20241026T141345.SAFE/GRANULE/L2A_T35SKC_A042375_20230803T091014/IMG_DATA/R10m/T35SKC_20230803T090601_B04_10m.jp2"
- type "image/jp2"
- title "Red (band 4) - 10m"
bands[] 1 items
0
- description "Red (band 4)"
- eo:center_wavelength 0.665
- eo:full_width_half_max 0.342
- name "B04"
- eo:common_name "red"
alternate
https
- href "https://zipper.dataspace.copernicus.eu/odata/v1/Products(73b75ce5-a1d8-4607-8555-bcb6ea6c02ee)/Nodes(S2A_MSIL2A_20230803T090601_N0510_R050_T35SKC_20241026T141345.SAFE)/Nodes(GRANULE)/Nodes(L2A_T35SKC_A042375_20230803T091014)/Nodes(IMG_DATA)/Nodes(R10m)/Nodes(T35SKC_20230803T090601_B04_10m.jp2)/$value"
auth:refs[] 1 items
- 0 "oidc"
- alternate:name "HTTPS"
- file:size 113029535
proj:bbox[] 4 items
- 0 199980
- 1 4190220
- 2 309780
- 3 4300020
- proj:code "EPSG:32635"
- view:azimuth 155.347511247118
- file:checksum "16209f5b7d28e0d2a416ef339b61f93781c726fb7ecefe7fbd67e12063d2c077da4e"
proj:transform[] 6 items
- 0 10
- 1 0
- 2 199980
- 3 0
- 4 -10
- 5 4300020
- file:local_path "S2A_MSIL2A_20230803T090601_N0510_R050_T35SKC_20241026T141345.SAFE/GRANULE/L2A_T35SKC_A042375_20230803T091014/IMG_DATA/R10m/T35SKC_20230803T090601_B04_10m.jp2"
- view:incidence_angle 2.78485356151954
- gsd 10
- nodata 0
auth:refs[] 1 items
- 0 "s3"
- data_type "uint16"
proj:shape[] 2 items
- 0 10980
- 1 10980
- raster:scale 0.0001
storage:refs[] 2 items
- 0 "cdse-s3"
- 1 "creodias-s3"
- raster:offset -0.1
- alternate:name "S3"
roles[] 4 items
- 0 "data"
- 1 "reflectance"
- 2 "sampling:original"
- 3 "gsd:10m"
B04_20m
- href "s3://eodata/Sentinel-2/MSI/L2A_N0500/2023/08/03/S2A_MSIL2A_20230803T090601_N0510_R050_T35SKC_20241026T141345.SAFE/GRANULE/L2A_T35SKC_A042375_20230803T091014/IMG_DATA/R20m/T35SKC_20230803T090601_B04_20m.jp2"
- type "image/jp2"
- title "Red (band 4) - 20m"
bands[] 1 items
0
- description "Red (band 4)"
- eo:center_wavelength 0.665
- eo:full_width_half_max 0.342
- name "B04"
- eo:common_name "red"
alternate
https
- href "https://zipper.dataspace.copernicus.eu/odata/v1/Products(73b75ce5-a1d8-4607-8555-bcb6ea6c02ee)/Nodes(S2A_MSIL2A_20230803T090601_N0510_R050_T35SKC_20241026T141345.SAFE)/Nodes(GRANULE)/Nodes(L2A_T35SKC_A042375_20230803T091014)/Nodes(IMG_DATA)/Nodes(R20m)/Nodes(T35SKC_20230803T090601_B04_20m.jp2)/$value"
auth:refs[] 1 items
- 0 "oidc"
- alternate:name "HTTPS"
- file:size 31296309
proj:bbox[] 4 items
- 0 199980
- 1 4190220
- 2 309780
- 3 4300020
- proj:code "EPSG:32635"
- view:azimuth 155.347511247118
- file:checksum "1620fb4e2ee248d219eb85d3e7067fc420eea13bff263d63abc9efcd98fe6fe224e8"
proj:transform[] 6 items
- 0 20
- 1 0
- 2 199980
- 3 0
- 4 -20
- 5 4300020
- file:local_path "S2A_MSIL2A_20230803T090601_N0510_R050_T35SKC_20241026T141345.SAFE/GRANULE/L2A_T35SKC_A042375_20230803T091014/IMG_DATA/R20m/T35SKC_20230803T090601_B04_20m.jp2"
- view:incidence_angle 2.78485356151954
- gsd 20
- nodata 0
auth:refs[] 1 items
- 0 "s3"
- data_type "uint16"
proj:shape[] 2 items
- 0 5490
- 1 5490
- raster:scale 0.0001
storage:refs[] 2 items
- 0 "cdse-s3"
- 1 "creodias-s3"
- raster:offset -0.1
- alternate:name "S3"
roles[] 4 items
- 0 "data"
- 1 "reflectance"
- 2 "sampling:downsampled"
- 3 "gsd:20m"
B04_60m
- href "s3://eodata/Sentinel-2/MSI/L2A_N0500/2023/08/03/S2A_MSIL2A_20230803T090601_N0510_R050_T35SKC_20241026T141345.SAFE/GRANULE/L2A_T35SKC_A042375_20230803T091014/IMG_DATA/R60m/T35SKC_20230803T090601_B04_60m.jp2"
- type "image/jp2"
- title "Red (band 4) - 60m"
bands[] 1 items
0
- description "Red (band 4)"
- eo:center_wavelength 0.665
- eo:full_width_half_max 0.342
- name "B04"
- eo:common_name "red"
alternate
https
- href "https://zipper.dataspace.copernicus.eu/odata/v1/Products(73b75ce5-a1d8-4607-8555-bcb6ea6c02ee)/Nodes(S2A_MSIL2A_20230803T090601_N0510_R050_T35SKC_20241026T141345.SAFE)/Nodes(GRANULE)/Nodes(L2A_T35SKC_A042375_20230803T091014)/Nodes(IMG_DATA)/Nodes(R60m)/Nodes(T35SKC_20230803T090601_B04_60m.jp2)/$value"
auth:refs[] 1 items
- 0 "oidc"
- alternate:name "HTTPS"
- file:size 3763747
proj:bbox[] 4 items
- 0 199980
- 1 4190220
- 2 309780
- 3 4300020
- proj:code "EPSG:32635"
- view:azimuth 155.347511247118
- file:checksum "16200d6168cf073a50000f21ff344ee21176000ea51c430e1f03ed87e3de51963beb"
proj:transform[] 6 items
- 0 60
- 1 0
- 2 199980
- 3 0
- 4 -60
- 5 4300020
- file:local_path "S2A_MSIL2A_20230803T090601_N0510_R050_T35SKC_20241026T141345.SAFE/GRANULE/L2A_T35SKC_A042375_20230803T091014/IMG_DATA/R60m/T35SKC_20230803T090601_B04_60m.jp2"
- view:incidence_angle 2.78485356151954
- gsd 60
- nodata 0
auth:refs[] 1 items
- 0 "s3"
- data_type "uint16"
proj:shape[] 2 items
- 0 1830
- 1 1830
- raster:scale 0.0001
storage:refs[] 2 items
- 0 "cdse-s3"
- 1 "creodias-s3"
- raster:offset -0.1
- alternate:name "S3"
roles[] 4 items
- 0 "data"
- 1 "reflectance"
- 2 "sampling:downsampled"
- 3 "gsd:60m"
B05_20m
- href "s3://eodata/Sentinel-2/MSI/L2A_N0500/2023/08/03/S2A_MSIL2A_20230803T090601_N0510_R050_T35SKC_20241026T141345.SAFE/GRANULE/L2A_T35SKC_A042375_20230803T091014/IMG_DATA/R20m/T35SKC_20230803T090601_B05_20m.jp2"
- type "image/jp2"
- title "Red edge 1 (band 5) - 20m"
bands[] 1 items
0
- description "Red edge 1 (band 5)"
- eo:center_wavelength 0.704
- eo:full_width_half_max 0.357
- name "B05"
- eo:common_name "rededge071"
alternate
https
- href "https://zipper.dataspace.copernicus.eu/odata/v1/Products(73b75ce5-a1d8-4607-8555-bcb6ea6c02ee)/Nodes(S2A_MSIL2A_20230803T090601_N0510_R050_T35SKC_20241026T141345.SAFE)/Nodes(GRANULE)/Nodes(L2A_T35SKC_A042375_20230803T091014)/Nodes(IMG_DATA)/Nodes(R20m)/Nodes(T35SKC_20230803T090601_B05_20m.jp2)/$value"
auth:refs[] 1 items
- 0 "oidc"
- alternate:name "HTTPS"
- file:size 30509746
proj:bbox[] 4 items
- 0 199980
- 1 4190220
- 2 309780
- 3 4300020
- proj:code "EPSG:32635"
- view:azimuth 154.804520320426
- file:checksum "162028f7d1e3b08f7a069f202ad4eace0d007a67ab738aaf24ee72806dc2e371704a"
proj:transform[] 6 items
- 0 20
- 1 0
- 2 199980
- 3 0
- 4 -20
- 5 4300020
- file:local_path "S2A_MSIL2A_20230803T090601_N0510_R050_T35SKC_20241026T141345.SAFE/GRANULE/L2A_T35SKC_A042375_20230803T091014/IMG_DATA/R20m/T35SKC_20230803T090601_B05_20m.jp2"
- view:incidence_angle 2.858380587873
- gsd 20
- nodata 0
auth:refs[] 1 items
- 0 "s3"
- data_type "uint16"
proj:shape[] 2 items
- 0 5490
- 1 5490
- raster:scale 0.0001
storage:refs[] 2 items
- 0 "cdse-s3"
- 1 "creodias-s3"
- raster:offset -0.1
- alternate:name "S3"
roles[] 4 items
- 0 "data"
- 1 "reflectance"
- 2 "sampling:original"
- 3 "gsd:20m"
B05_60m
- href "s3://eodata/Sentinel-2/MSI/L2A_N0500/2023/08/03/S2A_MSIL2A_20230803T090601_N0510_R050_T35SKC_20241026T141345.SAFE/GRANULE/L2A_T35SKC_A042375_20230803T091014/IMG_DATA/R60m/T35SKC_20230803T090601_B05_60m.jp2"
- type "image/jp2"
- title "Red edge 1 (band 5) - 60m"
bands[] 1 items
0
- description "Red edge 1 (band 5)"
- eo:center_wavelength 0.704
- eo:full_width_half_max 0.357
- name "B05"
- eo:common_name "rededge071"
alternate
https
- href "https://zipper.dataspace.copernicus.eu/odata/v1/Products(73b75ce5-a1d8-4607-8555-bcb6ea6c02ee)/Nodes(S2A_MSIL2A_20230803T090601_N0510_R050_T35SKC_20241026T141345.SAFE)/Nodes(GRANULE)/Nodes(L2A_T35SKC_A042375_20230803T091014)/Nodes(IMG_DATA)/Nodes(R60m)/Nodes(T35SKC_20230803T090601_B05_60m.jp2)/$value"
auth:refs[] 1 items
- 0 "oidc"
- alternate:name "HTTPS"
- file:size 3755600
proj:bbox[] 4 items
- 0 199980
- 1 4190220
- 2 309780
- 3 4300020
- proj:code "EPSG:32635"
- view:azimuth 154.804520320426
- file:checksum "1620470645cc1c6ae4d15446d1d7aa168ffc8b076772a2f03d7e1134e370040c380a"
proj:transform[] 6 items
- 0 60
- 1 0
- 2 199980
- 3 0
- 4 -60
- 5 4300020
- file:local_path "S2A_MSIL2A_20230803T090601_N0510_R050_T35SKC_20241026T141345.SAFE/GRANULE/L2A_T35SKC_A042375_20230803T091014/IMG_DATA/R60m/T35SKC_20230803T090601_B05_60m.jp2"
- view:incidence_angle 2.858380587873
- gsd 60
- nodata 0
auth:refs[] 1 items
- 0 "s3"
- data_type "uint16"
proj:shape[] 2 items
- 0 1830
- 1 1830
- raster:scale 0.0001
storage:refs[] 2 items
- 0 "cdse-s3"
- 1 "creodias-s3"
- raster:offset -0.1
- alternate:name "S3"
roles[] 4 items
- 0 "data"
- 1 "reflectance"
- 2 "sampling:downsampled"
- 3 "gsd:60m"
B06_20m
- href "s3://eodata/Sentinel-2/MSI/L2A_N0500/2023/08/03/S2A_MSIL2A_20230803T090601_N0510_R050_T35SKC_20241026T141345.SAFE/GRANULE/L2A_T35SKC_A042375_20230803T091014/IMG_DATA/R20m/T35SKC_20230803T090601_B06_20m.jp2"
- type "image/jp2"
- title "Red edge 2 (band 6) - 20m"
bands[] 1 items
0
- description "Red edge 2 (band 6)"
- eo:center_wavelength 0.741
- eo:full_width_half_max 0.374
- name "B06"
- eo:common_name "rededge075"
alternate
https
- href "https://zipper.dataspace.copernicus.eu/odata/v1/Products(73b75ce5-a1d8-4607-8555-bcb6ea6c02ee)/Nodes(S2A_MSIL2A_20230803T090601_N0510_R050_T35SKC_20241026T141345.SAFE)/Nodes(GRANULE)/Nodes(L2A_T35SKC_A042375_20230803T091014)/Nodes(IMG_DATA)/Nodes(R20m)/Nodes(T35SKC_20230803T090601_B06_20m.jp2)/$value"
auth:refs[] 1 items
- 0 "oidc"
- alternate:name "HTTPS"
- file:size 30445499
proj:bbox[] 4 items
- 0 199980
- 1 4190220
- 2 309780
- 3 4300020
- proj:code "EPSG:32635"
- view:azimuth 154.36733113758
- file:checksum "16203a45ed29fb20b77acfbe5e5434c4848ddc14feacf24744c1d02f17c73aae4e66"
proj:transform[] 6 items
- 0 20
- 1 0
- 2 199980
- 3 0
- 4 -20
- 5 4300020
- file:local_path "S2A_MSIL2A_20230803T090601_N0510_R050_T35SKC_20241026T141345.SAFE/GRANULE/L2A_T35SKC_A042375_20230803T091014/IMG_DATA/R20m/T35SKC_20230803T090601_B06_20m.jp2"
- view:incidence_angle 2.9362765383263
- gsd 20
- nodata 0
auth:refs[] 1 items
- 0 "s3"
- data_type "uint16"
proj:shape[] 2 items
- 0 5490
- 1 5490
- raster:scale 0.0001
storage:refs[] 2 items
- 0 "cdse-s3"
- 1 "creodias-s3"
- raster:offset -0.1
- alternate:name "S3"
roles[] 4 items
- 0 "data"
- 1 "reflectance"
- 2 "sampling:original"
- 3 "gsd:20m"
B06_60m
- href "s3://eodata/Sentinel-2/MSI/L2A_N0500/2023/08/03/S2A_MSIL2A_20230803T090601_N0510_R050_T35SKC_20241026T141345.SAFE/GRANULE/L2A_T35SKC_A042375_20230803T091014/IMG_DATA/R60m/T35SKC_20230803T090601_B06_60m.jp2"
- type "image/jp2"
- title "Red edge 2 (band 6) - 60m"
bands[] 1 items
0
- description "Red edge 2 (band 6)"
- eo:center_wavelength 0.741
- eo:full_width_half_max 0.374
- name "B06"
- eo:common_name "rededge075"
alternate
https
- href "https://zipper.dataspace.copernicus.eu/odata/v1/Products(73b75ce5-a1d8-4607-8555-bcb6ea6c02ee)/Nodes(S2A_MSIL2A_20230803T090601_N0510_R050_T35SKC_20241026T141345.SAFE)/Nodes(GRANULE)/Nodes(L2A_T35SKC_A042375_20230803T091014)/Nodes(IMG_DATA)/Nodes(R60m)/Nodes(T35SKC_20230803T090601_B06_60m.jp2)/$value"
auth:refs[] 1 items
- 0 "oidc"
- alternate:name "HTTPS"
- file:size 3753001
proj:bbox[] 4 items
- 0 199980
- 1 4190220
- 2 309780
- 3 4300020
- proj:code "EPSG:32635"
- view:azimuth 154.36733113758
- file:checksum "1620ee61aeead6ec30872822e53a36dcd8f9fa731b9e28af136863d2b9d768834e14"
proj:transform[] 6 items
- 0 60
- 1 0
- 2 199980
- 3 0
- 4 -60
- 5 4300020
- file:local_path "S2A_MSIL2A_20230803T090601_N0510_R050_T35SKC_20241026T141345.SAFE/GRANULE/L2A_T35SKC_A042375_20230803T091014/IMG_DATA/R60m/T35SKC_20230803T090601_B06_60m.jp2"
- view:incidence_angle 2.9362765383263
- gsd 60
- nodata 0
auth:refs[] 1 items
- 0 "s3"
- data_type "uint16"
proj:shape[] 2 items
- 0 1830
- 1 1830
- raster:scale 0.0001
storage:refs[] 2 items
- 0 "cdse-s3"
- 1 "creodias-s3"
- raster:offset -0.1
- alternate:name "S3"
roles[] 4 items
- 0 "data"
- 1 "reflectance"
- 2 "sampling:downsampled"
- 3 "gsd:60m"
B07_20m
- href "s3://eodata/Sentinel-2/MSI/L2A_N0500/2023/08/03/S2A_MSIL2A_20230803T090601_N0510_R050_T35SKC_20241026T141345.SAFE/GRANULE/L2A_T35SKC_A042375_20230803T091014/IMG_DATA/R20m/T35SKC_20230803T090601_B07_20m.jp2"
- type "image/jp2"
- title "Red edge 3 (band 7) - 20m"
bands[] 1 items
0
- description "Red edge 3 (band 7)"
- eo:center_wavelength 0.783
- eo:full_width_half_max 0.399
- name "B07"
- eo:common_name "rededge078"
alternate
https
- href "https://zipper.dataspace.copernicus.eu/odata/v1/Products(73b75ce5-a1d8-4607-8555-bcb6ea6c02ee)/Nodes(S2A_MSIL2A_20230803T090601_N0510_R050_T35SKC_20241026T141345.SAFE)/Nodes(GRANULE)/Nodes(L2A_T35SKC_A042375_20230803T091014)/Nodes(IMG_DATA)/Nodes(R20m)/Nodes(T35SKC_20230803T090601_B07_20m.jp2)/$value"
auth:refs[] 1 items
- 0 "oidc"
- alternate:name "HTTPS"
- file:size 30508948
proj:bbox[] 4 items
- 0 199980
- 1 4190220
- 2 309780
- 3 4300020
- proj:code "EPSG:32635"
- view:azimuth 153.719512310983
- file:checksum "1620a7d07f673c90e745726181aa9d2e5877fc0379d76a0bfcb76a64ec08a7f6b25e"
proj:transform[] 6 items
- 0 20
- 1 0
- 2 199980
- 3 0
- 4 -20
- 5 4300020
- file:local_path "S2A_MSIL2A_20230803T090601_N0510_R050_T35SKC_20241026T141345.SAFE/GRANULE/L2A_T35SKC_A042375_20230803T091014/IMG_DATA/R20m/T35SKC_20230803T090601_B07_20m.jp2"
- view:incidence_angle 3.01986190909965
- gsd 20
- nodata 0
auth:refs[] 1 items
- 0 "s3"
- data_type "uint16"
proj:shape[] 2 items
- 0 5490
- 1 5490
- raster:scale 0.0001
storage:refs[] 2 items
- 0 "cdse-s3"
- 1 "creodias-s3"
- raster:offset -0.1
- alternate:name "S3"
roles[] 4 items
- 0 "data"
- 1 "reflectance"
- 2 "sampling:original"
- 3 "gsd:20m"
B07_60m
- href "s3://eodata/Sentinel-2/MSI/L2A_N0500/2023/08/03/S2A_MSIL2A_20230803T090601_N0510_R050_T35SKC_20241026T141345.SAFE/GRANULE/L2A_T35SKC_A042375_20230803T091014/IMG_DATA/R60m/T35SKC_20230803T090601_B07_60m.jp2"
- type "image/jp2"
- title "Red edge 3 (band 7) - 60m"
- gsd 60
bands[] 1 items
0
- description "Red edge 3 (band 7)"
- eo:center_wavelength 0.783
- eo:full_width_half_max 0.399
- name "B07"
- eo:common_name "rededge078"
alternate
https
- href "https://zipper.dataspace.copernicus.eu/odata/v1/Products(73b75ce5-a1d8-4607-8555-bcb6ea6c02ee)/Nodes(S2A_MSIL2A_20230803T090601_N0510_R050_T35SKC_20241026T141345.SAFE)/Nodes(GRANULE)/Nodes(L2A_T35SKC_A042375_20230803T091014)/Nodes(IMG_DATA)/Nodes(R60m)/Nodes(T35SKC_20230803T090601_B07_60m.jp2)/$value"
auth:refs[] 1 items
- 0 "oidc"
- alternate:name "HTTPS"
- file:size 3729245
proj:bbox[] 4 items
- 0 199980
- 1 4190220
- 2 309780
- 3 4300020
- proj:code "EPSG:32635"
- view:azimuth 153.719512310983
- file:checksum "16205debcbdab04c3be78d8e42af86144cd22ac3fe93f68f4282212bb006d460b3f8"
proj:transform[] 6 items
- 0 60
- 1 0
- 2 199980
- 3 0
- 4 -60
- 5 4300020
- file:local_path "S2A_MSIL2A_20230803T090601_N0510_R050_T35SKC_20241026T141345.SAFE/GRANULE/L2A_T35SKC_A042375_20230803T091014/IMG_DATA/R60m/T35SKC_20230803T090601_B07_60m.jp2"
- view:incidence_angle 3.01986190909965
- nodata 0
auth:refs[] 1 items
- 0 "s3"
- data_type "uint16"
proj:shape[] 2 items
- 0 1830
- 1 1830
- raster:scale 0.0001
storage:refs[] 2 items
- 0 "cdse-s3"
- 1 "creodias-s3"
- raster:offset -0.1
- alternate:name "S3"
roles[] 4 items
- 0 "data"
- 1 "reflectance"
- 2 "sampling:downsampled"
- 3 "gsd:60m"
B08_10m
- href "s3://eodata/Sentinel-2/MSI/L2A_N0500/2023/08/03/S2A_MSIL2A_20230803T090601_N0510_R050_T35SKC_20241026T141345.SAFE/GRANULE/L2A_T35SKC_A042375_20230803T091014/IMG_DATA/R10m/T35SKC_20230803T090601_B08_10m.jp2"
- type "image/jp2"
- title "NIR 1 (band 8) - 10m"
bands[] 1 items
0
- description "NIR 1 (band 8)"
- eo:center_wavelength 0.833
- eo:full_width_half_max 0.454
- name "B08"
- eo:common_name "nir"
alternate
https
- href "https://zipper.dataspace.copernicus.eu/odata/v1/Products(73b75ce5-a1d8-4607-8555-bcb6ea6c02ee)/Nodes(S2A_MSIL2A_20230803T090601_N0510_R050_T35SKC_20241026T141345.SAFE)/Nodes(GRANULE)/Nodes(L2A_T35SKC_A042375_20230803T091014)/Nodes(IMG_DATA)/Nodes(R10m)/Nodes(T35SKC_20230803T090601_B08_10m.jp2)/$value"
auth:refs[] 1 items
- 0 "oidc"
- alternate:name "HTTPS"
- file:size 111400961
proj:bbox[] 4 items
- 0 199980
- 1 4190220
- 2 309780
- 3 4300020
- proj:code "EPSG:32635"
- view:azimuth 157.803309903783
- file:checksum "1620950ce1b93e725036c8c3a3a9b12a875064af7c960fa6f4653ea9cf3dcfe78254"
proj:transform[] 6 items
- 0 10
- 1 0
- 2 199980
- 3 0
- 4 -10
- 5 4300020
- file:local_path "S2A_MSIL2A_20230803T090601_N0510_R050_T35SKC_20241026T141345.SAFE/GRANULE/L2A_T35SKC_A042375_20230803T091014/IMG_DATA/R10m/T35SKC_20230803T090601_B08_10m.jp2"
- view:incidence_angle 2.60575361413951
- gsd 10
- nodata 0
auth:refs[] 1 items
- 0 "s3"
- data_type "uint16"
proj:shape[] 2 items
- 0 10980
- 1 10980
- raster:scale 0.0001
storage:refs[] 2 items
- 0 "cdse-s3"
- 1 "creodias-s3"
- raster:offset -0.1
- alternate:name "S3"
roles[] 4 items
- 0 "data"
- 1 "reflectance"
- 2 "sampling:original"
- 3 "gsd:10m"
B09_60m
- href "s3://eodata/Sentinel-2/MSI/L2A_N0500/2023/08/03/S2A_MSIL2A_20230803T090601_N0510_R050_T35SKC_20241026T141345.SAFE/GRANULE/L2A_T35SKC_A042375_20230803T091014/IMG_DATA/R60m/T35SKC_20230803T090601_B09_60m.jp2"
- type "image/jp2"
- title "NIR 3 (band 9) - 60m"
bands[] 1 items
0
- description "NIR 3 (band 9)"
- eo:center_wavelength 0.945
- eo:full_width_half_max 0.479
- name "B09"
- eo:common_name "nir09"
alternate
https
- href "https://zipper.dataspace.copernicus.eu/odata/v1/Products(73b75ce5-a1d8-4607-8555-bcb6ea6c02ee)/Nodes(S2A_MSIL2A_20230803T090601_N0510_R050_T35SKC_20241026T141345.SAFE)/Nodes(GRANULE)/Nodes(L2A_T35SKC_A042375_20230803T091014)/Nodes(IMG_DATA)/Nodes(R60m)/Nodes(T35SKC_20230803T090601_B09_60m.jp2)/$value"
auth:refs[] 1 items
- 0 "oidc"
- alternate:name "HTTPS"
- file:size 3759130
proj:bbox[] 4 items
- 0 199980
- 1 4190220
- 2 309780
- 3 4300020
- proj:code "EPSG:32635"
- view:azimuth 152.879208867467
- file:checksum "16205413308b06ea77692fb8b441301164a22444b9bcd81df6247682cda33daf1878"
proj:transform[] 6 items
- 0 60
- 1 0
- 2 199980
- 3 0
- 4 -60
- 5 4300020
- file:local_path "S2A_MSIL2A_20230803T090601_N0510_R050_T35SKC_20241026T141345.SAFE/GRANULE/L2A_T35SKC_A042375_20230803T091014/IMG_DATA/R60m/T35SKC_20230803T090601_B09_60m.jp2"
- view:incidence_angle 3.2915079385702
- gsd 60
- nodata 0
auth:refs[] 1 items
- 0 "s3"
- data_type "uint16"
proj:shape[] 2 items
- 0 1830
- 1 1830
- raster:scale 0.0001
storage:refs[] 2 items
- 0 "cdse-s3"
- 1 "creodias-s3"
- raster:offset -0.1
- alternate:name "S3"
roles[] 4 items
- 0 "data"
- 1 "reflectance"
- 2 "sampling:original"
- 3 "gsd:60m"
B11_20m
- href "s3://eodata/Sentinel-2/MSI/L2A_N0500/2023/08/03/S2A_MSIL2A_20230803T090601_N0510_R050_T35SKC_20241026T141345.SAFE/GRANULE/L2A_T35SKC_A042375_20230803T091014/IMG_DATA/R20m/T35SKC_20230803T090601_B11_20m.jp2"
- type "image/jp2"
- title "SWIR 1 (band 11) - 20m"
bands[] 1 items
0
- description "SWIR 1 (band 11)"
- eo:center_wavelength 1.614
- eo:full_width_half_max 0.841
- name "B11"
- eo:common_name "swir16"
alternate
https
- href "https://zipper.dataspace.copernicus.eu/odata/v1/Products(73b75ce5-a1d8-4607-8555-bcb6ea6c02ee)/Nodes(S2A_MSIL2A_20230803T090601_N0510_R050_T35SKC_20241026T141345.SAFE)/Nodes(GRANULE)/Nodes(L2A_T35SKC_A042375_20230803T091014)/Nodes(IMG_DATA)/Nodes(R20m)/Nodes(T35SKC_20230803T090601_B11_20m.jp2)/$value"
auth:refs[] 1 items
- 0 "oidc"
- alternate:name "HTTPS"
- file:size 28092583
proj:bbox[] 4 items
- 0 199980
- 1 4190220
- 2 309780
- 3 4300020
- proj:code "EPSG:32635"
- view:azimuth 153.873373881579
- file:checksum "16201a729a649def946b66c316c39d3bb6fc2a63c60d2057d2d8358e8433a6915890"
proj:transform[] 6 items
- 0 20
- 1 0
- 2 199980
- 3 0
- 4 -20
- 5 4300020
- file:local_path "S2A_MSIL2A_20230803T090601_N0510_R050_T35SKC_20241026T141345.SAFE/GRANULE/L2A_T35SKC_A042375_20230803T091014/IMG_DATA/R20m/T35SKC_20230803T090601_B11_20m.jp2"
- view:incidence_angle 2.93141709428352
- gsd 20
- nodata 0
auth:refs[] 1 items
- 0 "s3"
- data_type "uint16"
proj:shape[] 2 items
- 0 5490
- 1 5490
- raster:scale 0.0001
storage:refs[] 2 items
- 0 "cdse-s3"
- 1 "creodias-s3"
- raster:offset -0.1
- alternate:name "S3"
roles[] 4 items
- 0 "data"
- 1 "reflectance"
- 2 "sampling:original"
- 3 "gsd:20m"
B11_60m
- href "s3://eodata/Sentinel-2/MSI/L2A_N0500/2023/08/03/S2A_MSIL2A_20230803T090601_N0510_R050_T35SKC_20241026T141345.SAFE/GRANULE/L2A_T35SKC_A042375_20230803T091014/IMG_DATA/R60m/T35SKC_20230803T090601_B11_60m.jp2"
- type "image/jp2"
- title "SWIR 1 (band 11) - 60m"
bands[] 1 items
0
- description "SWIR 1 (band 11)"
- eo:center_wavelength 1.614
- eo:full_width_half_max 0.841
- name "B11"
- eo:common_name "swir16"
alternate
https
- href "https://zipper.dataspace.copernicus.eu/odata/v1/Products(73b75ce5-a1d8-4607-8555-bcb6ea6c02ee)/Nodes(S2A_MSIL2A_20230803T090601_N0510_R050_T35SKC_20241026T141345.SAFE)/Nodes(GRANULE)/Nodes(L2A_T35SKC_A042375_20230803T091014)/Nodes(IMG_DATA)/Nodes(R60m)/Nodes(T35SKC_20230803T090601_B11_60m.jp2)/$value"
auth:refs[] 1 items
- 0 "oidc"
- alternate:name "HTTPS"
- file:size 3723208
proj:bbox[] 4 items
- 0 199980
- 1 4190220
- 2 309780
- 3 4300020
- proj:code "EPSG:32635"
- view:azimuth 153.873373881579
- file:checksum "1620dfb881959702d0cc733df96bec87b94c2be4e03e6b02ec8bb9599a50643cafc9"
proj:transform[] 6 items
- 0 60
- 1 0
- 2 199980
- 3 0
- 4 -60
- 5 4300020
- file:local_path "S2A_MSIL2A_20230803T090601_N0510_R050_T35SKC_20241026T141345.SAFE/GRANULE/L2A_T35SKC_A042375_20230803T091014/IMG_DATA/R60m/T35SKC_20230803T090601_B11_60m.jp2"
- view:incidence_angle 2.93141709428352
- gsd 60
- nodata 0
auth:refs[] 1 items
- 0 "s3"
- data_type "uint16"
proj:shape[] 2 items
- 0 1830
- 1 1830
- raster:scale 0.0001
storage:refs[] 2 items
- 0 "cdse-s3"
- 1 "creodias-s3"
- raster:offset -0.1
- alternate:name "S3"
roles[] 4 items
- 0 "data"
- 1 "reflectance"
- 2 "sampling:downsampled"
- 3 "gsd:60m"
B12_20m
- href "s3://eodata/Sentinel-2/MSI/L2A_N0500/2023/08/03/S2A_MSIL2A_20230803T090601_N0510_R050_T35SKC_20241026T141345.SAFE/GRANULE/L2A_T35SKC_A042375_20230803T091014/IMG_DATA/R20m/T35SKC_20230803T090601_B12_20m.jp2"
- type "image/jp2"
- title "SWIR 2 (band 12) - 20m"
bands[] 1 items
0
- description "SWIR 2 (band 12)"
- eo:center_wavelength 2.202
- eo:full_width_half_max 1.16
- name "B12"
- eo:common_name "swir22"
alternate
https
- href "https://zipper.dataspace.copernicus.eu/odata/v1/Products(73b75ce5-a1d8-4607-8555-bcb6ea6c02ee)/Nodes(S2A_MSIL2A_20230803T090601_N0510_R050_T35SKC_20241026T141345.SAFE)/Nodes(GRANULE)/Nodes(L2A_T35SKC_A042375_20230803T091014)/Nodes(IMG_DATA)/Nodes(R20m)/Nodes(T35SKC_20230803T090601_B12_20m.jp2)/$value"
auth:refs[] 1 items
- 0 "oidc"
- alternate:name "HTTPS"
- file:size 28178455
proj:bbox[] 4 items
- 0 199980
- 1 4190220
- 2 309780
- 3 4300020
- proj:code "EPSG:32635"
- view:azimuth 153.111878471117
- file:checksum "162061a149db836e6f6022897f7ff4f596618a6a639e0cebf8e039aee7576980c5a6"
proj:transform[] 6 items
- 0 20
- 1 0
- 2 199980
- 3 0
- 4 -20
- 5 4300020
- file:local_path "S2A_MSIL2A_20230803T090601_N0510_R050_T35SKC_20241026T141345.SAFE/GRANULE/L2A_T35SKC_A042375_20230803T091014/IMG_DATA/R20m/T35SKC_20230803T090601_B12_20m.jp2"
- view:incidence_angle 3.1314437589701
- gsd 20
- nodata 0
auth:refs[] 1 items
- 0 "s3"
- data_type "uint16"
proj:shape[] 2 items
- 0 5490
- 1 5490
- raster:scale 0.0001
storage:refs[] 2 items
- 0 "cdse-s3"
- 1 "creodias-s3"
- raster:offset -0.1
- alternate:name "S3"
roles[] 4 items
- 0 "data"
- 1 "reflectance"
- 2 "sampling:original"
- 3 "gsd:20m"
B12_60m
- href "s3://eodata/Sentinel-2/MSI/L2A_N0500/2023/08/03/S2A_MSIL2A_20230803T090601_N0510_R050_T35SKC_20241026T141345.SAFE/GRANULE/L2A_T35SKC_A042375_20230803T091014/IMG_DATA/R60m/T35SKC_20230803T090601_B12_60m.jp2"
- type "image/jp2"
- title "SWIR 2 (band 12) - 60m"
bands[] 1 items
0
- description "SWIR 2 (band 12)"
- eo:center_wavelength 2.202
- eo:full_width_half_max 1.16
- name "B12"
- eo:common_name "swir22"
alternate
https
- href "https://zipper.dataspace.copernicus.eu/odata/v1/Products(73b75ce5-a1d8-4607-8555-bcb6ea6c02ee)/Nodes(S2A_MSIL2A_20230803T090601_N0510_R050_T35SKC_20241026T141345.SAFE)/Nodes(GRANULE)/Nodes(L2A_T35SKC_A042375_20230803T091014)/Nodes(IMG_DATA)/Nodes(R60m)/Nodes(T35SKC_20230803T090601_B12_60m.jp2)/$value"
auth:refs[] 1 items
- 0 "oidc"
- alternate:name "HTTPS"
- file:size 3766461
proj:bbox[] 4 items
- 0 199980
- 1 4190220
- 2 309780
- 3 4300020
- proj:code "EPSG:32635"
- view:azimuth 153.111878471117
- file:checksum "162040e69ff42f9564db6b502472304ec72dda827b6727ab22ecbc4efb7140e0e624"
proj:transform[] 6 items
- 0 60
- 1 0
- 2 199980
- 3 0
- 4 -60
- 5 4300020
- file:local_path "S2A_MSIL2A_20230803T090601_N0510_R050_T35SKC_20241026T141345.SAFE/GRANULE/L2A_T35SKC_A042375_20230803T091014/IMG_DATA/R60m/T35SKC_20230803T090601_B12_60m.jp2"
- view:incidence_angle 3.1314437589701
- gsd 60
- nodata 0
auth:refs[] 1 items
- 0 "s3"
- data_type "uint16"
proj:shape[] 2 items
- 0 1830
- 1 1830
- raster:scale 0.0001
storage:refs[] 2 items
- 0 "cdse-s3"
- 1 "creodias-s3"
- raster:offset -0.1
- alternate:name "S3"
roles[] 4 items
- 0 "data"
- 1 "reflectance"
- 2 "sampling:downsampled"
- 3 "gsd:60m"
B8A_20m
- href "s3://eodata/Sentinel-2/MSI/L2A_N0500/2023/08/03/S2A_MSIL2A_20230803T090601_N0510_R050_T35SKC_20241026T141345.SAFE/GRANULE/L2A_T35SKC_A042375_20230803T091014/IMG_DATA/R20m/T35SKC_20230803T090601_B8A_20m.jp2"
- type "image/jp2"
- title "NIR 2 (band 8A) - 20m"
bands[] 1 items
0
- description "NIR 2 (band 8A)"
- eo:center_wavelength 0.865
- eo:full_width_half_max 0.441
- name "B8A"
- eo:common_name "nir08"
alternate
https
- href "https://zipper.dataspace.copernicus.eu/odata/v1/Products(73b75ce5-a1d8-4607-8555-bcb6ea6c02ee)/Nodes(S2A_MSIL2A_20230803T090601_N0510_R050_T35SKC_20241026T141345.SAFE)/Nodes(GRANULE)/Nodes(L2A_T35SKC_A042375_20230803T091014)/Nodes(IMG_DATA)/Nodes(R20m)/Nodes(T35SKC_20230803T090601_B8A_20m.jp2)/$value"
auth:refs[] 1 items
- 0 "oidc"
- alternate:name "HTTPS"
- file:size 30578291
proj:bbox[] 4 items
- 0 199980
- 1 4190220
- 2 309780
- 3 4300020
- proj:code "EPSG:32635"
- view:azimuth 153.434309868891
- file:checksum "1620dafedc4dad378dd823ef8176fd7cb154fb3770cbe433b4bd542087ed0c681f3b"
proj:transform[] 6 items
- 0 20
- 1 0
- 2 199980
- 3 0
- 4 -20
- 5 4300020
- file:local_path "S2A_MSIL2A_20230803T090601_N0510_R050_T35SKC_20241026T141345.SAFE/GRANULE/L2A_T35SKC_A042375_20230803T091014/IMG_DATA/R20m/T35SKC_20230803T090601_B8A_20m.jp2"
- view:incidence_angle 3.10562104656229
- gsd 20
- nodata 0
auth:refs[] 1 items
- 0 "s3"
- data_type "uint16"
proj:shape[] 2 items
- 0 5490
- 1 5490
- raster:scale 0.0001
storage:refs[] 2 items
- 0 "cdse-s3"
- 1 "creodias-s3"
- raster:offset -0.1
- alternate:name "S3"
roles[] 4 items
- 0 "data"
- 1 "reflectance"
- 2 "sampling:original"
- 3 "gsd:20m"
B8A_60m
- href "s3://eodata/Sentinel-2/MSI/L2A_N0500/2023/08/03/S2A_MSIL2A_20230803T090601_N0510_R050_T35SKC_20241026T141345.SAFE/GRANULE/L2A_T35SKC_A042375_20230803T091014/IMG_DATA/R60m/T35SKC_20230803T090601_B8A_60m.jp2"
- type "image/jp2"
- title "NIR 2 (band 8A) - 60m"
bands[] 1 items
0
- description "NIR 2 (band 8A)"
- eo:center_wavelength 0.865
- eo:full_width_half_max 0.441
- name "B8A"
- eo:common_name "nir08"
alternate
https
- href "https://zipper.dataspace.copernicus.eu/odata/v1/Products(73b75ce5-a1d8-4607-8555-bcb6ea6c02ee)/Nodes(S2A_MSIL2A_20230803T090601_N0510_R050_T35SKC_20241026T141345.SAFE)/Nodes(GRANULE)/Nodes(L2A_T35SKC_A042375_20230803T091014)/Nodes(IMG_DATA)/Nodes(R60m)/Nodes(T35SKC_20230803T090601_B8A_60m.jp2)/$value"
auth:refs[] 1 items
- 0 "oidc"
- alternate:name "HTTPS"
- file:size 3735502
proj:bbox[] 4 items
- 0 199980
- 1 4190220
- 2 309780
- 3 4300020
- proj:code "EPSG:32635"
- view:azimuth 153.434309868891
- file:checksum "1620cb70f2859d53881cffb7f66ad287915f86589e2fb471512b94749c764e730433"
proj:transform[] 6 items
- 0 60
- 1 0
- 2 199980
- 3 0
- 4 -60
- 5 4300020
- file:local_path "S2A_MSIL2A_20230803T090601_N0510_R050_T35SKC_20241026T141345.SAFE/GRANULE/L2A_T35SKC_A042375_20230803T091014/IMG_DATA/R60m/T35SKC_20230803T090601_B8A_60m.jp2"
- view:incidence_angle 3.10562104656229
- gsd 60
- nodata 0
auth:refs[] 1 items
- 0 "s3"
- data_type "uint16"
proj:shape[] 2 items
- 0 1830
- 1 1830
- raster:scale 0.0001
storage:refs[] 2 items
- 0 "cdse-s3"
- 1 "creodias-s3"
- raster:offset -0.1
- alternate:name "S3"
roles[] 4 items
- 0 "data"
- 1 "reflectance"
- 2 "sampling:downsampled"
- 3 "gsd:60m"
Product
- href "https://download.dataspace.copernicus.eu/odata/v1/Products(73b75ce5-a1d8-4607-8555-bcb6ea6c02ee)/$value"
- type "application/zip"
- title "Zipped product"
- file:size 1050567004
- file:checksum "d50110140e028af1855177e00d80e5dc0e9378"
- alternate:name "HTTPS"
- file:local_path "S2A_MSIL2A_20230803T090601_N0510_R050_T35SKC_20241026T141345.SAFE.zip"
auth:refs[] 1 items
- 0 "oidc"
roles[] 3 items
- 0 "data"
- 1 "metadata"
- 2 "archive"
SCL_20m
- href "s3://eodata/Sentinel-2/MSI/L2A_N0500/2023/08/03/S2A_MSIL2A_20230803T090601_N0510_R050_T35SKC_20241026T141345.SAFE/GRANULE/L2A_T35SKC_A042375_20230803T091014/IMG_DATA/R20m/T35SKC_20230803T090601_SCL_20m.jp2"
- type "image/jp2"
- title "Scene classification map (SCL) - 20m"
alternate
https
- href "https://zipper.dataspace.copernicus.eu/odata/v1/Products(73b75ce5-a1d8-4607-8555-bcb6ea6c02ee)/Nodes(S2A_MSIL2A_20230803T090601_N0510_R050_T35SKC_20241026T141345.SAFE)/Nodes(GRANULE)/Nodes(L2A_T35SKC_A042375_20230803T091014)/Nodes(IMG_DATA)/Nodes(R20m)/Nodes(T35SKC_20230803T090601_SCL_20m.jp2)/$value"
auth:refs[] 1 items
- 0 "oidc"
- alternate:name "HTTPS"
- file:size 1503886
proj:bbox[] 4 items
- 0 199980
- 1 4190220
- 2 309780
- 3 4300020
- proj:code "EPSG:32635"
- file:checksum "1620745de982eca3bff88205d22eaeb1481061324fd9522335e0fa88c56bd05177ea"
proj:transform[] 6 items
- 0 20
- 1 0
- 2 199980
- 3 0
- 4 -20
- 5 4300020
- file:local_path "S2A_MSIL2A_20230803T090601_N0510_R050_T35SKC_20241026T141345.SAFE/GRANULE/L2A_T35SKC_A042375_20230803T091014/IMG_DATA/R20m/T35SKC_20230803T090601_SCL_20m.jp2"
classification:classes[] 12 items
0
- percentage 0.0
- name "no_data"
- value 0
- nodata True
1
- name "saturated_or_defective"
- value 1
- percentage 0.0
2
- percentage 0.11092900000000001
- name "dark_area_pixels"
- value 2
3
- percentage 0.148264
- name "cloud_shadows"
- value 3
4
- percentage 16.675684
- name "vegetation"
- value 4
5
- percentage 23.095714
- name "not_vegetated"
- value 5
6
- percentage 59.716868
- name "water"
- value 6
7
- percentage 0.034555
- name "unclassified"
- value 7
8
- percentage 0.133948
- name "cloud_medium_probability"
- value 8
9
- percentage 0.083643
- name "cloud_high_probability"
- value 9
10
- percentage 0.000206
- name "thin_cirrus"
- value 10
11
- percentage 0.000189
- name "snow"
- value 11
- gsd 20
- nodata 0
auth:refs[] 1 items
- 0 "s3"
- data_type "uint8"
proj:shape[] 2 items
- 0 5490
- 1 5490
storage:refs[] 2 items
- 0 "cdse-s3"
- 1 "creodias-s3"
- alternate:name "S3"
roles[] 3 items
- 0 "data"
- 1 "sampling:original"
- 2 "gsd:20m"
SCL_60m
- href "s3://eodata/Sentinel-2/MSI/L2A_N0500/2023/08/03/S2A_MSIL2A_20230803T090601_N0510_R050_T35SKC_20241026T141345.SAFE/GRANULE/L2A_T35SKC_A042375_20230803T091014/IMG_DATA/R60m/T35SKC_20230803T090601_SCL_60m.jp2"
- type "image/jp2"
- title "Scene classification map (SCL) - 60m"
alternate
https
- href "https://zipper.dataspace.copernicus.eu/odata/v1/Products(73b75ce5-a1d8-4607-8555-bcb6ea6c02ee)/Nodes(S2A_MSIL2A_20230803T090601_N0510_R050_T35SKC_20241026T141345.SAFE)/Nodes(GRANULE)/Nodes(L2A_T35SKC_A042375_20230803T091014)/Nodes(IMG_DATA)/Nodes(R60m)/Nodes(T35SKC_20230803T090601_SCL_60m.jp2)/$value"
auth:refs[] 1 items
- 0 "oidc"
- alternate:name "HTTPS"
- file:size 285602
proj:bbox[] 4 items
- 0 199980
- 1 4190220
- 2 309780
- 3 4300020
- proj:code "EPSG:32635"
- file:checksum "1620e7ce054877aba84a678ee307d41d4e13ecfc475376caaef48ec97c1a57814657"
proj:transform[] 6 items
- 0 60
- 1 0
- 2 199980
- 3 0
- 4 -60
- 5 4300020
- file:local_path "S2A_MSIL2A_20230803T090601_N0510_R050_T35SKC_20241026T141345.SAFE/GRANULE/L2A_T35SKC_A042375_20230803T091014/IMG_DATA/R60m/T35SKC_20230803T090601_SCL_60m.jp2"
- gsd 60
- nodata 0
auth:refs[] 1 items
- 0 "s3"
- data_type "uint8"
proj:shape[] 2 items
- 0 1830
- 1 1830
storage:refs[] 2 items
- 0 "cdse-s3"
- 1 "creodias-s3"
- alternate:name "S3"
classification:classes[] 12 items
0
- name "no_data"
- value 0
- nodata True
1
- name "saturated_or_defective"
- value 1
2
- name "dark_area_pixels"
- value 2
3
- name "cloud_shadows"
- value 3
4
- name "vegetation"
- value 4
5
- name "not_vegetated"
- value 5
6
- name "water"
- value 6
7
- name "unclassified"
- value 7
8
- name "cloud_medium_probability"
- value 8
9
- name "cloud_high_probability"
- value 9
10
- name "thin_cirrus"
- value 10
11
- name "snow"
- value 11
roles[] 3 items
- 0 "data"
- 1 "sampling:downsampled"
- 2 "gsd:60m"
TCI_10m
- href "s3://eodata/Sentinel-2/MSI/L2A_N0500/2023/08/03/S2A_MSIL2A_20230803T090601_N0510_R050_T35SKC_20241026T141345.SAFE/GRANULE/L2A_T35SKC_A042375_20230803T091014/IMG_DATA/R10m/T35SKC_20230803T090601_TCI_10m.jp2"
- type "image/jp2"
- title "True color image"
bands[] 3 items
0
- eo:center_wavelength 0.665
- eo:full_width_half_max 0.342
- name "B04"
- description "Red (band 4)"
- eo:common_name "red"
1
- eo:center_wavelength 0.56
- eo:full_width_half_max 0.291
- name "B03"
- description "Green (band 3)"
- eo:common_name "green"
2
- eo:center_wavelength 0.493
- eo:full_width_half_max 0.267
- name "B02"
- description "Blue (band 2)"
- eo:common_name "blue"
alternate
https
- href "https://zipper.dataspace.copernicus.eu/odata/v1/Products(73b75ce5-a1d8-4607-8555-bcb6ea6c02ee)/Nodes(S2A_MSIL2A_20230803T090601_N0510_R050_T35SKC_20241026T141345.SAFE)/Nodes(GRANULE)/Nodes(L2A_T35SKC_A042375_20230803T091014)/Nodes(IMG_DATA)/Nodes(R10m)/Nodes(T35SKC_20230803T090601_TCI_10m.jp2)/$value"
auth:refs[] 1 items
- 0 "oidc"
- alternate:name "HTTPS"
- file:size 135354087
proj:bbox[] 4 items
- 0 199980
- 1 4190220
- 2 309780
- 3 4300020
- proj:code "EPSG:32635"
- file:checksum "16204ab1419086d453de734f498386df3bdfe775a8b2b11d9f898b745467b466888b"
proj:transform[] 6 items
- 0 10
- 1 0
- 2 199980
- 3 0
- 4 -10
- 5 4300020
- file:local_path "S2A_MSIL2A_20230803T090601_N0510_R050_T35SKC_20241026T141345.SAFE/GRANULE/L2A_T35SKC_A042375_20230803T091014/IMG_DATA/R10m/T35SKC_20230803T090601_TCI_10m.jp2"
- gsd 10
- nodata 0
auth:refs[] 1 items
- 0 "s3"
- data_type "uint8"
proj:shape[] 2 items
- 0 10980
- 1 10980
storage:refs[] 2 items
- 0 "cdse-s3"
- 1 "creodias-s3"
- alternate:name "S3"
roles[] 3 items
- 0 "visual"
- 1 "sampling:original"
- 2 "gsd:10m"
TCI_20m
- href "s3://eodata/Sentinel-2/MSI/L2A_N0500/2023/08/03/S2A_MSIL2A_20230803T090601_N0510_R050_T35SKC_20241026T141345.SAFE/GRANULE/L2A_T35SKC_A042375_20230803T091014/IMG_DATA/R20m/T35SKC_20230803T090601_TCI_20m.jp2"
- type "image/jp2"
- title "True color image"
bands[] 3 items
0
- eo:center_wavelength 0.665
- eo:full_width_half_max 0.342
- name "B04"
- description "Red (band 4)"
- eo:common_name "red"
1
- eo:center_wavelength 0.56
- eo:full_width_half_max 0.291
- name "B03"
- description "Green (band 3)"
- eo:common_name "green"
2
- eo:center_wavelength 0.493
- eo:full_width_half_max 0.267
- name "B02"
- description "Blue (band 2)"
- eo:common_name "blue"
alternate
https
- href "https://zipper.dataspace.copernicus.eu/odata/v1/Products(73b75ce5-a1d8-4607-8555-bcb6ea6c02ee)/Nodes(S2A_MSIL2A_20230803T090601_N0510_R050_T35SKC_20241026T141345.SAFE)/Nodes(GRANULE)/Nodes(L2A_T35SKC_A042375_20230803T091014)/Nodes(IMG_DATA)/Nodes(R20m)/Nodes(T35SKC_20230803T090601_TCI_20m.jp2)/$value"
auth:refs[] 1 items
- 0 "oidc"
- alternate:name "HTTPS"
- file:size 33878150
proj:bbox[] 4 items
- 0 199980
- 1 4190220
- 2 309780
- 3 4300020
- proj:code "EPSG:32635"
- file:checksum "1620d9d197a38b31935186a64bb52384fc65bd76f5882e3fbdd428437230a66deb41"
proj:transform[] 6 items
- 0 20
- 1 0
- 2 199980
- 3 0
- 4 -20
- 5 4300020
- file:local_path "S2A_MSIL2A_20230803T090601_N0510_R050_T35SKC_20241026T141345.SAFE/GRANULE/L2A_T35SKC_A042375_20230803T091014/IMG_DATA/R20m/T35SKC_20230803T090601_TCI_20m.jp2"
- gsd 20
- nodata 0
auth:refs[] 1 items
- 0 "s3"
- data_type "uint8"
proj:shape[] 2 items
- 0 5490
- 1 5490
storage:refs[] 2 items
- 0 "cdse-s3"
- 1 "creodias-s3"
- alternate:name "S3"
roles[] 3 items
- 0 "visual"
- 1 "sampling:downsampled"
- 2 "gsd:20m"
TCI_60m
- href "s3://eodata/Sentinel-2/MSI/L2A_N0500/2023/08/03/S2A_MSIL2A_20230803T090601_N0510_R050_T35SKC_20241026T141345.SAFE/GRANULE/L2A_T35SKC_A042375_20230803T091014/IMG_DATA/R60m/T35SKC_20230803T090601_TCI_60m.jp2"
- type "image/jp2"
- title "True color image"
bands[] 3 items
0
- eo:center_wavelength 0.665
- eo:full_width_half_max 0.342
- name "B04"
- description "Red (band 4)"
- eo:common_name "red"
1
- eo:center_wavelength 0.56
- eo:full_width_half_max 0.291
- name "B03"
- description "Green (band 3)"
- eo:common_name "green"
2
- eo:center_wavelength 0.493
- eo:full_width_half_max 0.267
- name "B02"
- description "Blue (band 2)"
- eo:common_name "blue"
alternate
https
- href "https://zipper.dataspace.copernicus.eu/odata/v1/Products(73b75ce5-a1d8-4607-8555-bcb6ea6c02ee)/Nodes(S2A_MSIL2A_20230803T090601_N0510_R050_T35SKC_20241026T141345.SAFE)/Nodes(GRANULE)/Nodes(L2A_T35SKC_A042375_20230803T091014)/Nodes(IMG_DATA)/Nodes(R60m)/Nodes(T35SKC_20230803T090601_TCI_60m.jp2)/$value"
auth:refs[] 1 items
- 0 "oidc"
- alternate:name "HTTPS"
- file:size 3751642
proj:bbox[] 4 items
- 0 199980
- 1 4190220
- 2 309780
- 3 4300020
- proj:code "EPSG:32635"
- file:checksum "162099646232bf6657baff67e07d115149aec2bace20e0f67040a8ff5de606484594"
proj:transform[] 6 items
- 0 60
- 1 0
- 2 199980
- 3 0
- 4 -60
- 5 4300020
- file:local_path "S2A_MSIL2A_20230803T090601_N0510_R050_T35SKC_20241026T141345.SAFE/GRANULE/L2A_T35SKC_A042375_20230803T091014/IMG_DATA/R60m/T35SKC_20230803T090601_TCI_60m.jp2"
- gsd 60
- nodata 0
auth:refs[] 1 items
- 0 "s3"
- data_type "uint8"
proj:shape[] 2 items
- 0 1830
- 1 1830
storage:refs[] 2 items
- 0 "cdse-s3"
- 1 "creodias-s3"
- alternate:name "S3"
roles[] 3 items
- 0 "visual"
- 1 "sampling:downsampled"
- 2 "gsd:60m"
WVP_10m
- href "s3://eodata/Sentinel-2/MSI/L2A_N0500/2023/08/03/S2A_MSIL2A_20230803T090601_N0510_R050_T35SKC_20241026T141345.SAFE/GRANULE/L2A_T35SKC_A042375_20230803T091014/IMG_DATA/R10m/T35SKC_20230803T090601_WVP_10m.jp2"
- type "image/jp2"
- title "Water vapour (WVP) - 10m"
alternate
https
- href "https://zipper.dataspace.copernicus.eu/odata/v1/Products(73b75ce5-a1d8-4607-8555-bcb6ea6c02ee)/Nodes(S2A_MSIL2A_20230803T090601_N0510_R050_T35SKC_20241026T141345.SAFE)/Nodes(GRANULE)/Nodes(L2A_T35SKC_A042375_20230803T091014)/Nodes(IMG_DATA)/Nodes(R10m)/Nodes(T35SKC_20230803T090601_WVP_10m.jp2)/$value"
auth:refs[] 1 items
- 0 "oidc"
- alternate:name "HTTPS"
- file:size 43017989
proj:bbox[] 4 items
- 0 199980
- 1 4190220
- 2 309780
- 3 4300020
- proj:code "EPSG:32635"
- file:checksum "1620638e9b9880db71d08a7aea2019d2a6253f8d9606c54375c2a4f1d94c88990f2b"
proj:transform[] 6 items
- 0 10
- 1 0
- 2 199980
- 3 0
- 4 -10
- 5 4300020
- file:local_path "S2A_MSIL2A_20230803T090601_N0510_R050_T35SKC_20241026T141345.SAFE/GRANULE/L2A_T35SKC_A042375_20230803T091014/IMG_DATA/R10m/T35SKC_20230803T090601_WVP_10m.jp2"
- gsd 10
- nodata 0
auth:refs[] 1 items
- 0 "s3"
- data_type "uint16"
proj:shape[] 2 items
- 0 10980
- 1 10980
- raster:scale 0.0001
storage:refs[] 2 items
- 0 "cdse-s3"
- 1 "creodias-s3"
- raster:offset -0.1
- alternate:name "S3"
roles[] 2 items
- 0 "data"
- 1 "gsd:10m"
WVP_20m
- href "s3://eodata/Sentinel-2/MSI/L2A_N0500/2023/08/03/S2A_MSIL2A_20230803T090601_N0510_R050_T35SKC_20241026T141345.SAFE/GRANULE/L2A_T35SKC_A042375_20230803T091014/IMG_DATA/R20m/T35SKC_20230803T090601_WVP_20m.jp2"
- type "image/jp2"
- title "Water vapour (WVP) - 20m"
alternate
https
- href "https://zipper.dataspace.copernicus.eu/odata/v1/Products(73b75ce5-a1d8-4607-8555-bcb6ea6c02ee)/Nodes(S2A_MSIL2A_20230803T090601_N0510_R050_T35SKC_20241026T141345.SAFE)/Nodes(GRANULE)/Nodes(L2A_T35SKC_A042375_20230803T091014)/Nodes(IMG_DATA)/Nodes(R20m)/Nodes(T35SKC_20230803T090601_WVP_20m.jp2)/$value"
auth:refs[] 1 items
- 0 "oidc"
- alternate:name "HTTPS"
- file:size 13529709
proj:bbox[] 4 items
- 0 199980
- 1 4190220
- 2 309780
- 3 4300020
- proj:code "EPSG:32635"
- file:checksum "1620a8bd4bbce5ebfc2ed1a7e28e306c0d2f2d7b2a8d9d15fef7a600f22ccfd31757"
proj:transform[] 6 items
- 0 20
- 1 0
- 2 199980
- 3 0
- 4 -20
- 5 4300020
- file:local_path "S2A_MSIL2A_20230803T090601_N0510_R050_T35SKC_20241026T141345.SAFE/GRANULE/L2A_T35SKC_A042375_20230803T091014/IMG_DATA/R20m/T35SKC_20230803T090601_WVP_20m.jp2"
- gsd 20
- nodata 0
auth:refs[] 1 items
- 0 "s3"
- data_type "uint16"
proj:shape[] 2 items
- 0 5490
- 1 5490
- raster:scale 0.0001
storage:refs[] 2 items
- 0 "cdse-s3"
- 1 "creodias-s3"
- raster:offset -0.1
- alternate:name "S3"
roles[] 2 items
- 0 "data"
- 1 "gsd:20m"
WVP_60m
- href "s3://eodata/Sentinel-2/MSI/L2A_N0500/2023/08/03/S2A_MSIL2A_20230803T090601_N0510_R050_T35SKC_20241026T141345.SAFE/GRANULE/L2A_T35SKC_A042375_20230803T091014/IMG_DATA/R60m/T35SKC_20230803T090601_WVP_60m.jp2"
- type "image/jp2"
- title "Water vapour (WVP) - 60m"
alternate
https
- href "https://zipper.dataspace.copernicus.eu/odata/v1/Products(73b75ce5-a1d8-4607-8555-bcb6ea6c02ee)/Nodes(S2A_MSIL2A_20230803T090601_N0510_R050_T35SKC_20241026T141345.SAFE)/Nodes(GRANULE)/Nodes(L2A_T35SKC_A042375_20230803T091014)/Nodes(IMG_DATA)/Nodes(R60m)/Nodes(T35SKC_20230803T090601_WVP_60m.jp2)/$value"
auth:refs[] 1 items
- 0 "oidc"
- alternate:name "HTTPS"
- file:size 1916092
proj:bbox[] 4 items
- 0 199980
- 1 4190220
- 2 309780
- 3 4300020
- proj:code "EPSG:32635"
- file:checksum "16209c7878e8293773d226c2d647c21565855b52cb60e37051f18905446a866f7513"
proj:transform[] 6 items
- 0 60
- 1 0
- 2 199980
- 3 0
- 4 -60
- 5 4300020
- file:local_path "S2A_MSIL2A_20230803T090601_N0510_R050_T35SKC_20241026T141345.SAFE/GRANULE/L2A_T35SKC_A042375_20230803T091014/IMG_DATA/R60m/T35SKC_20230803T090601_WVP_60m.jp2"
- gsd 60
- nodata 0
auth:refs[] 1 items
- 0 "s3"
- data_type "uint16"
proj:shape[] 2 items
- 0 1830
- 1 1830
- raster:scale 0.0001
storage:refs[] 2 items
- 0 "cdse-s3"
- 1 "creodias-s3"
- raster:offset -0.1
- alternate:name "S3"
roles[] 2 items
- 0 "data"
- 1 "gsd:60m"
thumbnail
- href "https://datahub.creodias.eu/odata/v1/Assets(31aa4b3a-420e-496d-9e9d-112443317b33)/$value"
- type "image/jpeg"
- title "Quicklook"
alternate
s3
- href "s3://eodata/Sentinel-2/MSI/L2A_N0500/2023/08/03/S2A_MSIL2A_20230803T090601_N0510_R050_T35SKC_20241026T141345.SAFE/S2A_MSIL2A_20230803T090601_N0510_R050_T35SKC_20241026T141345-ql.jpg"
auth:refs[] 1 items
- 0 "s3"
storage:refs[] 2 items
- 0 "cdse-s3"
- 1 "creodias-s3"
- alternate:name "S3"
- file:size 30376
- file:checksum "d50110fa226bd223fcce41ee51eecf6cbdf9de"
- file:local_path "S2A_MSIL2A_20230803T090601_N0510_R050_T35SKC_20241026T141345.SAFE/S2A_MSIL2A_20230803T090601_N0510_R050_T35SKC_20241026T141345-ql.jpg"
- data_type "uint8"
- proj:code None
proj:shape[] 2 items
- 0 343
- 1 343
- alternate:name "HTTPS"
roles[] 2 items
- 0 "thumbnail"
- 1 "overview"
safe_manifest
- href "s3://eodata/Sentinel-2/MSI/L2A_N0500/2023/08/03/S2A_MSIL2A_20230803T090601_N0510_R050_T35SKC_20241026T141345.SAFE/manifest.safe"
- type "application/xml"
- title "manifest.safe"
alternate
https
- href "https://zipper.dataspace.copernicus.eu/odata/v1/Products(73b75ce5-a1d8-4607-8555-bcb6ea6c02ee)/Nodes(S2A_MSIL2A_20230803T090601_N0510_R050_T35SKC_20241026T141345.SAFE)/Nodes(manifest.safe)/$value"
auth:refs[] 1 items
- 0 "oidc"
- alternate:name "HTTPS"
- file:size 68901
- file:checksum "d501101a5db091de853884ac91aea355b30f7b"
- file:local_path "S2A_MSIL2A_20230803T090601_N0510_R050_T35SKC_20241026T141345.SAFE/manifest.safe"
auth:refs[] 1 items
- 0 "s3"
storage:refs[] 2 items
- 0 "cdse-s3"
- 1 "creodias-s3"
- alternate:name "S3"
roles[] 1 items
- 0 "metadata"
granule_metadata
- href "s3://eodata/Sentinel-2/MSI/L2A_N0500/2023/08/03/S2A_MSIL2A_20230803T090601_N0510_R050_T35SKC_20241026T141345.SAFE/GRANULE/L2A_T35SKC_A042375_20230803T091014/MTD_TL.xml"
- type "application/xml"
- title "MTD_TL.xml"
alternate
https
- href "https://zipper.dataspace.copernicus.eu/odata/v1/Products(73b75ce5-a1d8-4607-8555-bcb6ea6c02ee)/Nodes(S2A_MSIL2A_20230803T090601_N0510_R050_T35SKC_20241026T141345.SAFE)/Nodes(GRANULE)/Nodes(L2A_T35SKC_A042375_20230803T091014)/Nodes(MTD_TL.xml)/$value"
auth:refs[] 1 items
- 0 "oidc"
- alternate:name "HTTPS"
- file:size 626708
- file:checksum "d50120ee81480c619184ef6257aa680c21452b288e4781edc3a1866a4599f4b726a2cb"
- file:local_path "S2A_MSIL2A_20230803T090601_N0510_R050_T35SKC_20241026T141345.SAFE/GRANULE/L2A_T35SKC_A042375_20230803T091014/MTD_TL.xml"
auth:refs[] 1 items
- 0 "s3"
storage:refs[] 2 items
- 0 "cdse-s3"
- 1 "creodias-s3"
- alternate:name "S3"
roles[] 1 items
- 0 "metadata"
inspire_metadata
- href "s3://eodata/Sentinel-2/MSI/L2A_N0500/2023/08/03/S2A_MSIL2A_20230803T090601_N0510_R050_T35SKC_20241026T141345.SAFE/INSPIRE.xml"
- type "application/xml"
- title "INSPIRE.xml"
alternate
https
- href "https://zipper.dataspace.copernicus.eu/odata/v1/Products(73b75ce5-a1d8-4607-8555-bcb6ea6c02ee)/Nodes(S2A_MSIL2A_20230803T090601_N0510_R050_T35SKC_20241026T141345.SAFE)/Nodes(INSPIRE.xml)/$value"
auth:refs[] 1 items
- 0 "oidc"
- alternate:name "HTTPS"
- file:size 18643
- file:checksum "d501202d2fb22b9933fa4169bb350949c895a9aa7e476ae86814aa1990f4070e1872dc"
- file:local_path "S2A_MSIL2A_20230803T090601_N0510_R050_T35SKC_20241026T141345.SAFE/INSPIRE.xml"
auth:refs[] 1 items
- 0 "s3"
storage:refs[] 2 items
- 0 "cdse-s3"
- 1 "creodias-s3"
- alternate:name "S3"
roles[] 1 items
- 0 "metadata"
product_metadata
- href "s3://eodata/Sentinel-2/MSI/L2A_N0500/2023/08/03/S2A_MSIL2A_20230803T090601_N0510_R050_T35SKC_20241026T141345.SAFE/MTD_MSIL2A.xml"
- type "application/xml"
- title "MTD_MSIL2A.xml"
alternate
https
- href "https://zipper.dataspace.copernicus.eu/odata/v1/Products(73b75ce5-a1d8-4607-8555-bcb6ea6c02ee)/Nodes(S2A_MSIL2A_20230803T090601_N0510_R050_T35SKC_20241026T141345.SAFE)/Nodes(MTD_MSIL2A.xml)/$value"
auth:refs[] 1 items
- 0 "oidc"
- alternate:name "HTTPS"
- file:size 54863
- file:checksum "d501202d499eed173c507b431f987a012057dc2efb9b5b6a84fef245b234058da10fbc"
- file:local_path "S2A_MSIL2A_20230803T090601_N0510_R050_T35SKC_20241026T141345.SAFE/MTD_MSIL2A.xml"
auth:refs[] 1 items
- 0 "s3"
storage:refs[] 2 items
- 0 "cdse-s3"
- 1 "creodias-s3"
- alternate:name "S3"
roles[] 1 items
- 0 "metadata"
datastrip_metadata
- href "s3://eodata/Sentinel-2/MSI/L2A_N0500/2023/08/03/S2A_MSIL2A_20230803T090601_N0510_R050_T35SKC_20241026T141345.SAFE/DATASTRIP/DS_S2RP_20241026T141345_S20230803T091014/MTD_DS.xml"
- type "application/xml"
- title "MTD_DS.xml"
alternate
https
- href "https://zipper.dataspace.copernicus.eu/odata/v1/Products(73b75ce5-a1d8-4607-8555-bcb6ea6c02ee)/Nodes(S2A_MSIL2A_20230803T090601_N0510_R050_T35SKC_20241026T141345.SAFE)/Nodes(DATASTRIP)/Nodes(DS_S2RP_20241026T141345_S20230803T091014)/Nodes(MTD_DS.xml)/$value"
auth:refs[] 1 items
- 0 "oidc"
- alternate:name "HTTPS"
- file:size 24055746
- file:checksum "d50120059441bdf6db09b4cf7e4be9ae17b9adbbc0e96366ff107748ab416e414f4ca0"
- file:local_path "S2A_MSIL2A_20230803T090601_N0510_R050_T35SKC_20241026T141345.SAFE/DATASTRIP/DS_S2RP_20241026T141345_S20230803T091014/MTD_DS.xml"
auth:refs[] 1 items
- 0 "s3"
storage:refs[] 2 items
- 0 "cdse-s3"
- 1 "creodias-s3"
- alternate:name "S3"
roles[] 1 items
- 0 "metadata"
- collection "sentinel-2-l2a"
Create a bounding box around the point#
epsg = "32635"

# Convert point of interest into the image projection
# (assumes all images are in the same projection)
poidf = gpd.GeoDataFrame(
    pd.DataFrame(),
    crs="EPSG:4326",
    geometry=[Point(lon, lat)],
).to_crs(epsg)

coords = poidf.iloc[0].geometry.coords[0]

# Create bounds in projection
size = 256
gsd = 10
bounds = (
    coords[0] - (size * gsd) // 2,
    coords[1] - (size * gsd) // 2,
    coords[0] + (size * gsd) // 2,
    coords[1] + (size * gsd) // 2,
)
Use STACKSTAC to retrieve the datacube#
gdal_env = stackstac.DEFAULT_GDAL_ENV.updated(
    {"GDAL_HTTP_UNSAFESSL":"YES",
     "GDAL_HTTP_TCP_KEEPALIVE":"YES",
     "AWS_VIRTUAL_HOSTING":"FALSE",
     "AWS_HTTPS":"YES"
    }
)

# Create the stack using stackstac
stack = stackstac.stack(
    items,
    bounds=bounds,
    snap_bounds=False,
    resolution=gsd,
    dtype="float64",
    rescale=False,
    fill_value=0,
    assets=["B02_10m", "B03_10m", "B04_10m", "B08_10m"],
    resampling=Resampling.nearest,
    epsg=32635,
    gdal_env=gdal_env,
)

print(stack)

# Compute the stack
stack = stack.compute()
<xarray.DataArray 'stackstac-1830d39c342e736bfaf74c48d39e8b4a' (time: 5,
                                                                band: 4,
                                                                y: 256, x: 256)> Size: 10MB
dask.array<fetch_raster_window, shape=(5, 4, 256, 256), dtype=float64, chunksize=(1, 1, 256, 256), chunktype=numpy.ndarray>
Coordinates: (12/53)
  * time                                   (time) datetime64[ns] 40B 2023-08-...
    id                                     (time) <U60 1kB 'S2A_MSIL2A_202308...
  * band                                   (band) <U7 112B 'B02_10m' ... 'B08...
  * x                                      (x) float64 2kB 2.113e+05 ... 2.13...
  * y                                      (y) float64 2kB 4.21e+06 ... 4.208...
    processing:level                       <U2 8B 'L2'
    ...                                     ...
    proj:transform                         object 8B {0, 10, 199980, 4300020,...
    proj:shape                             object 8B {10980}
    title                                  (band) <U20 320B 'Blue (band 2) - ...
    storage:refs                           object 8B {'creodias-s3', 'cdse-s3'}
    proj:code                              <U10 40B 'EPSG:32635'
    epsg                                   int64 8B 32635
Attributes:
    spec:        RasterSpec(epsg=32635, bounds=(211301.8144811028, 4207792.27...
    crs:         epsg:32635
    transform:   | 10.00, 0.00, 211301.81|\n| 0.00,-10.00, 4210352.27|\n| 0.0...
    resolution:  10
Visualize the RGB bands#
stack.sel(band=["B04_10m", "B03_10m", "B02_10m"]).plot.imshow(
    row="time", rgb="band", vmin=0, vmax=2000, col_wrap=6
)
<xarray.plot.facetgrid.FacetGrid at 0x12ff456a0>